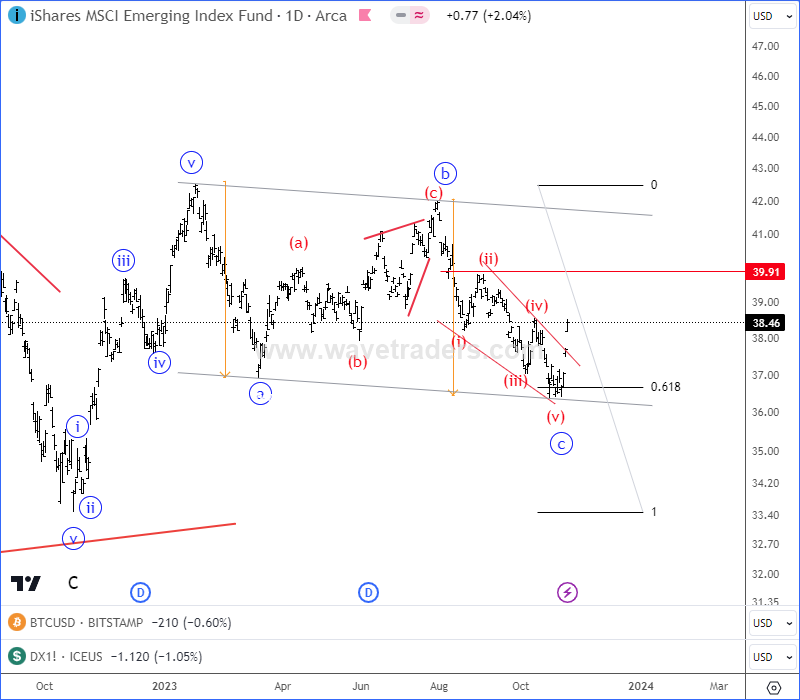
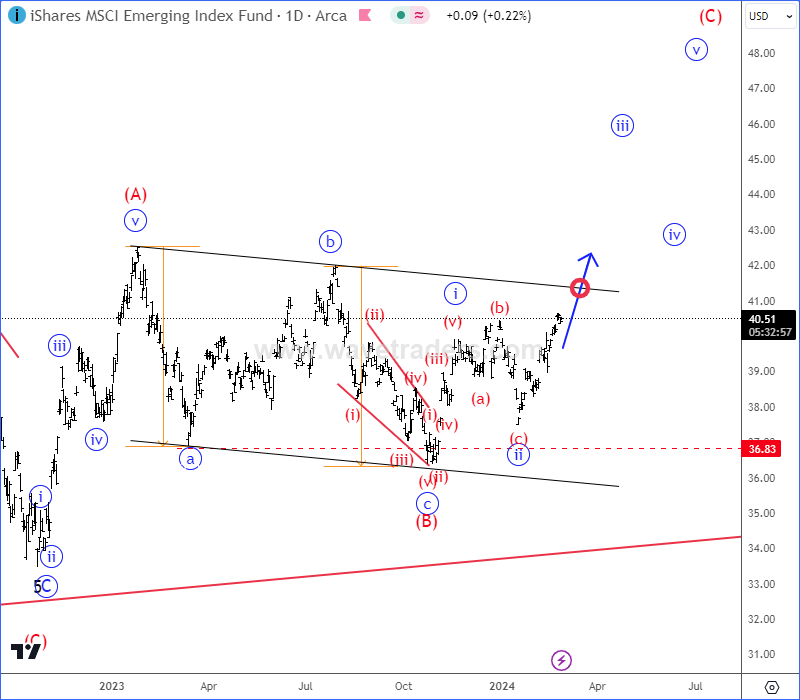
Emerging Markets Are Trading Bullish from technical point of view and from Elliott wave perspective as expected.
Emerging markets chart with ticker EEM has been trading slow and sideways for the last year, mainly because of weak China stocks. But, we have been warning about a corrective a-b-c movement with nice support at 61,8% Fibo. retracement and 36-35 area last year. We talked about bullish EEM back in August, September and November of 2023, where we mentioned and highlighted a correction within bullish trend.
EEM vs. USD Video Analysis From August 21 2023. CLICK HERE
EEM Free Chart From September 21 2023. CLICK HERE
On November 6th of 2023, we have actually spotted a completed a-b-c correction and we warned about a bullish continuation. EEM Blog From November 06 2023. CLICK HERE

As you can see today, EEM is trying to continue higher within a five-wave bullish impulse, so more gains can be seen this year, especially if breaks channel resistance line and 42 region. Bullish EEM is supportive for the stock market across the globe and it can send it even higher, but we believe that most of that rally may come from China.

Become a premium member
Get daily Elliott Wave updates for US Single Stocks, SP500,DAX, GOLD, SILVER, CRUDE, FX, CRYPTO, etc. or apply for unlimited access to the Elliot Wave educational videos.
Bitcoin Cash Is Breaking Out Of Bullish Triangle. Check our free chart HERE.