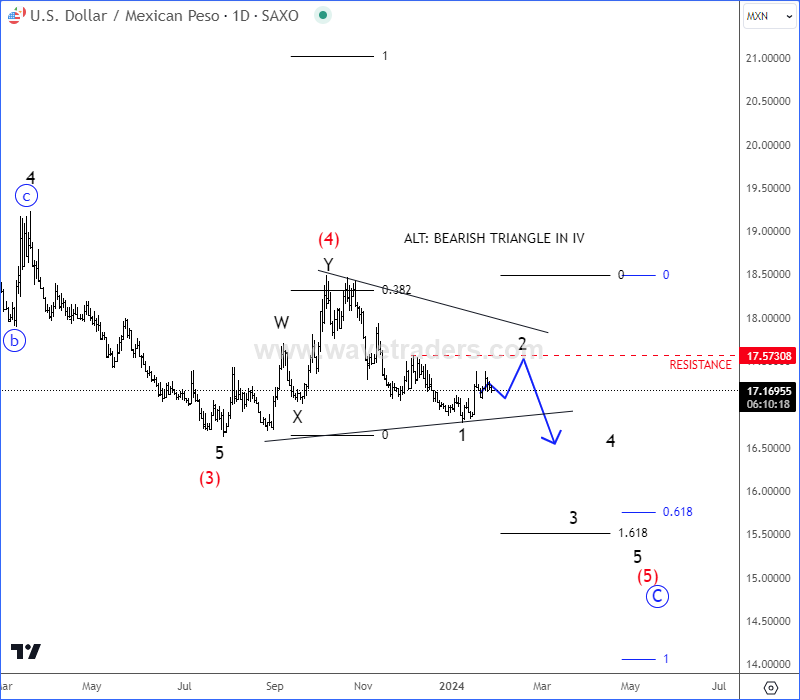
USDMXN Is Making A Corrective Pullback Within Bearish Trend from technical perspective and by Elliott wave theory.
USDMXN is trading lower for the last three years or so and it can be headed much lower as recent price action and wave structure looks like a correction within downtrend on a daily chart. Well, this was seen as a corrective and temporary bounce; wave (4), which puts wave (5) in action, so weakness is ready to resume, ideally within a five-wave cycle of the lower degree down to the 16.00-15.60 area. In case if stays sideways for a longer period of time, then alternatively it may also form a bearish triangle pattern.

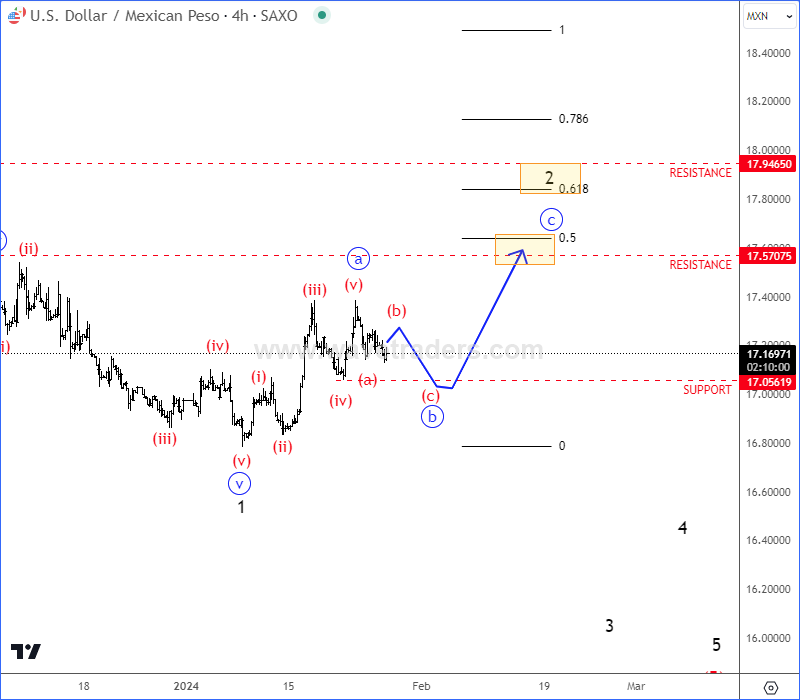
If we take a closer look, in the 4-hour chart, we can see it making a corrective a-b-c pullback within wave 2 that can retest 17.50 – 18.00 resistance zone before before we will see a bearish resumption for wave 3.

Become a premium member
Get daily Elliott Wave updates for US Single Stocks, SP500,DAX, GOLD, SILVER, CRUDE, FX, CRYPTO, etc. or apply for unlimited access to the Elliot Wave educational videos.
ChainLink Is Unfolding A Five-Wave Impulse. Check our free chart HERE.