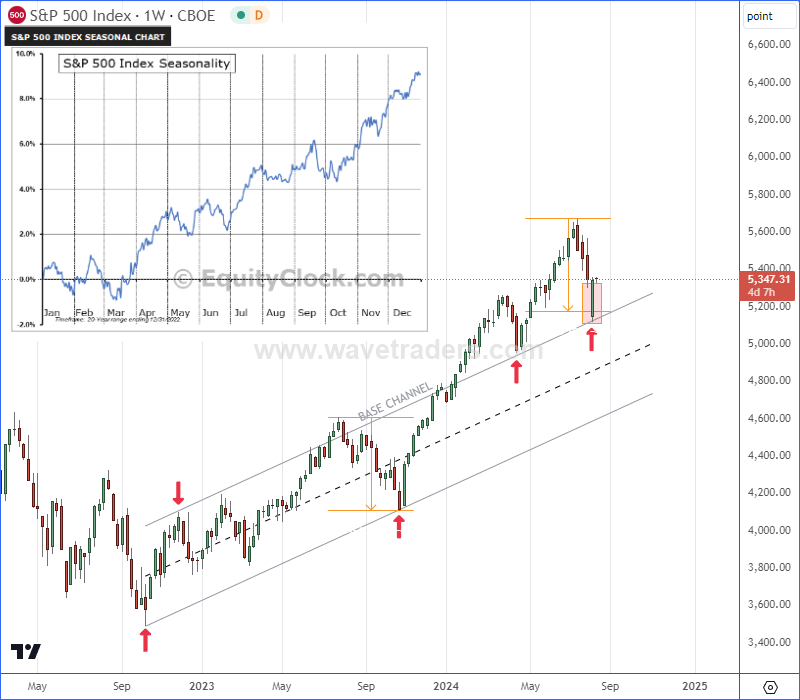
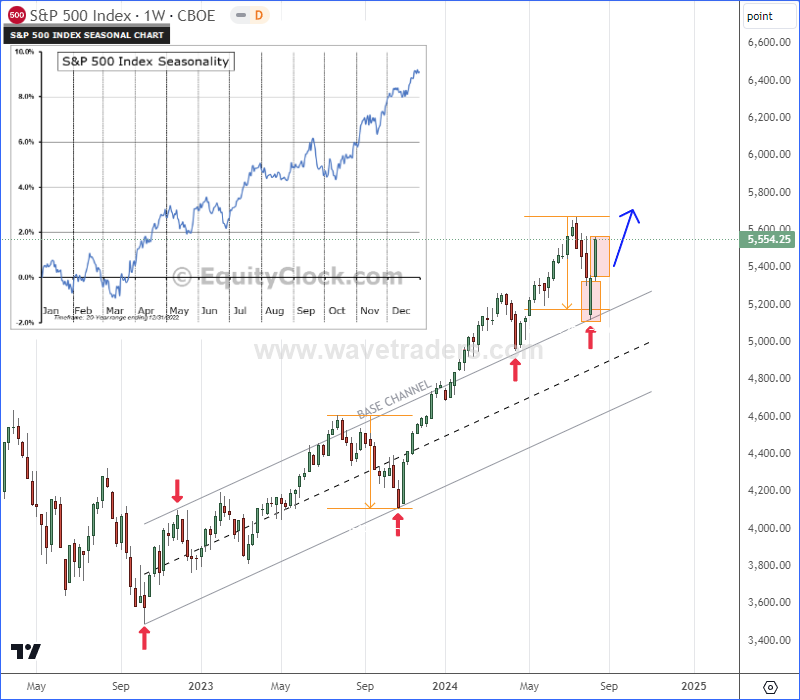
SP500 with ticker $SPX made a nice August slow down based on seasonality chart, but we warned about a huge green weekly candle away from base channel resistance line that act as a support. A week later, we got another huge green weekly candlestick, which indicates that bulls are strong, so $stocks will most likely stay in the uptrend in current risk-on sentiment. How long until SP500 hits new all-time highs?
Become a premium member
Get daily Elliott Wave updates for US Single Stocks, SP500,DAX, GOLD, SILVER, CRUDE, FX, CRYPTO, etc. or apply for unlimited access to the Elliot Wave educational videos.