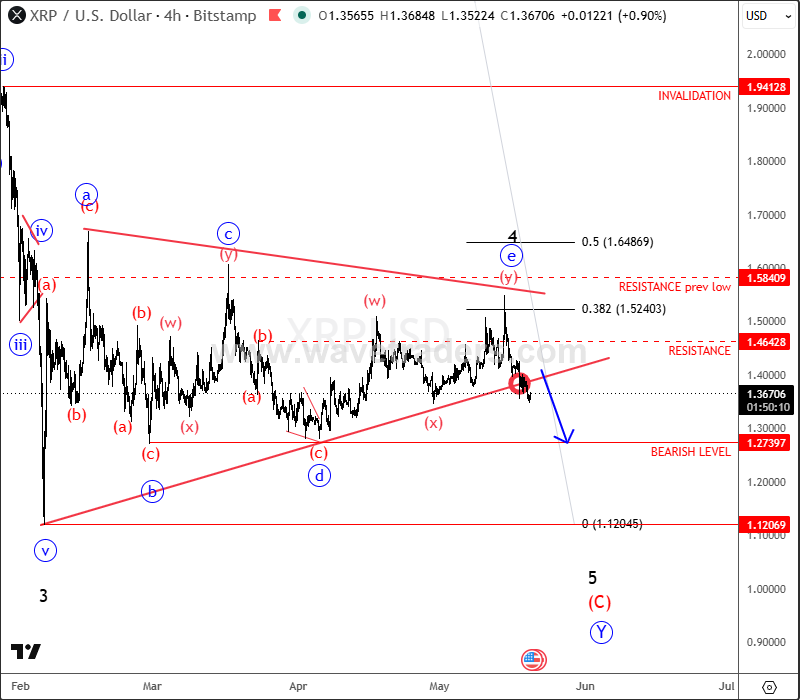
Ripple seems bearish; we can now see it finishing the final subwave “e” of 4 at 1.5 – 1.6 resistance area, so it can now drop the price towards the 1.0 support level, especially if it slips and closes below the lower triangle line support, and later below 1.27 level. This next big leg down, can be final in a higher degree bearish sequence, so still some interesting rebound is expected to show upin second half of this year.
Become a premium member
Get daily Elliott Wave updates for US Single Stocks, SP500,DAX, GOLD, SILVER, CRUDE, FX, CRYPTO, etc. or apply for unlimited access to the Elliot Wave educational videos.