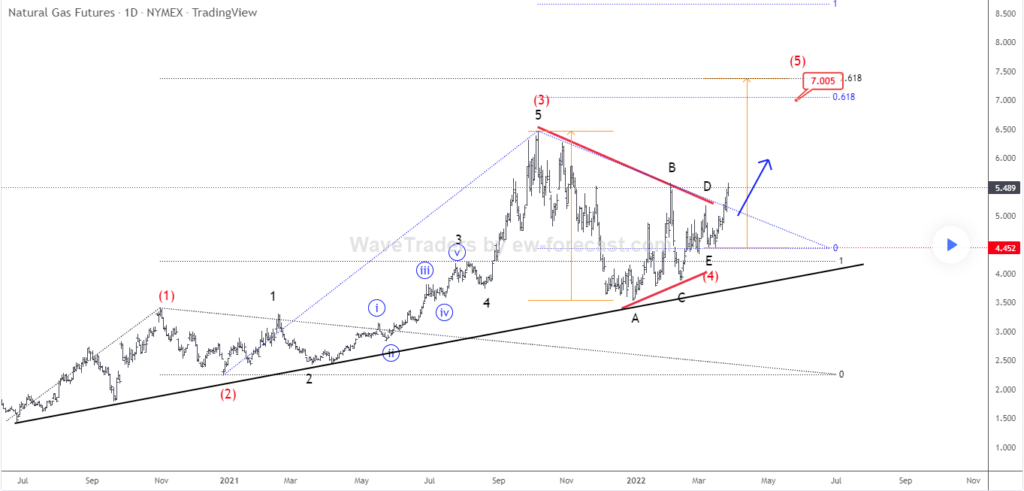
Natural gas is up since 2020 lows and looks like it’s still unfolding five waves up from the lows. From Elliott Wave perspective, we are currently tracking big bullish triangle pattern in wave (4). Which looks to be completed with recent breakout above upper triangle line. So, if we are on the right path, then Natgas can be on the way even higher. Ideally towards 7 area for wave (5). Where we see important Fibonacci cluster target zone.
From technical perspective, as long as the price is above strong daily black trendline connected from 2020 lows and above 4.0 level. We can expect a bullish continuation at least towards 7.0 area.
