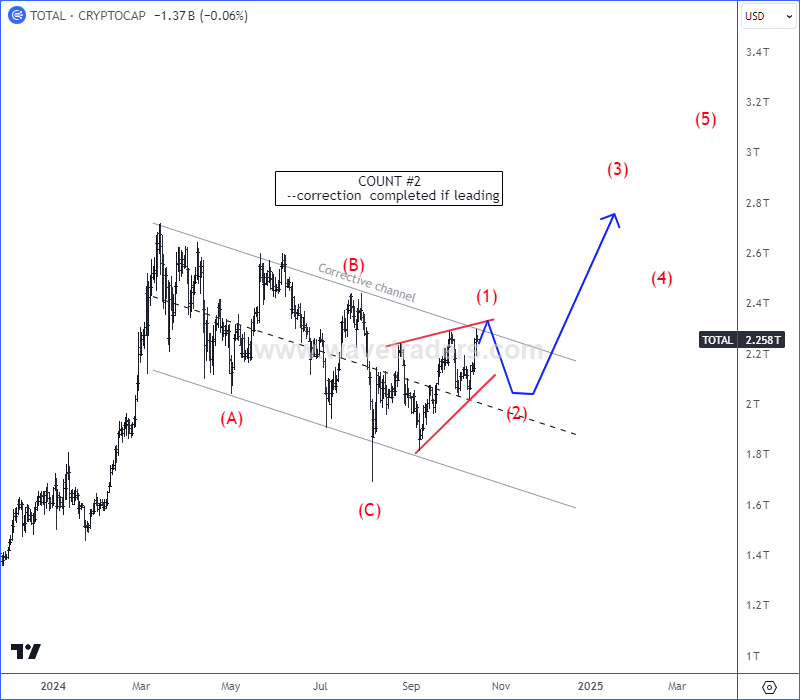
Crypto market is nicely rising, but we still see some key resistance levels here around 2.3T area for wave (1) of a leading diagonal pattern. If we suddenly see a reversal down, then we are back in the weekly range and we should be aware of a new corrective slow-down in wave (2) before a bullish continuation for wave (3) of a five-wave bullish cycle. However, if we see a strong continuation higher this week above 2.4T area, then bulls could be real, where wave (3) of an impulse can be already in play.
Become a premium member
Get daily Elliott Wave updates for US Single Stocks, SP500,DAX, GOLD, SILVER, CRUDE, FX, CRYPTO, etc. or apply for unlimited access to the Elliot Wave educational videos.