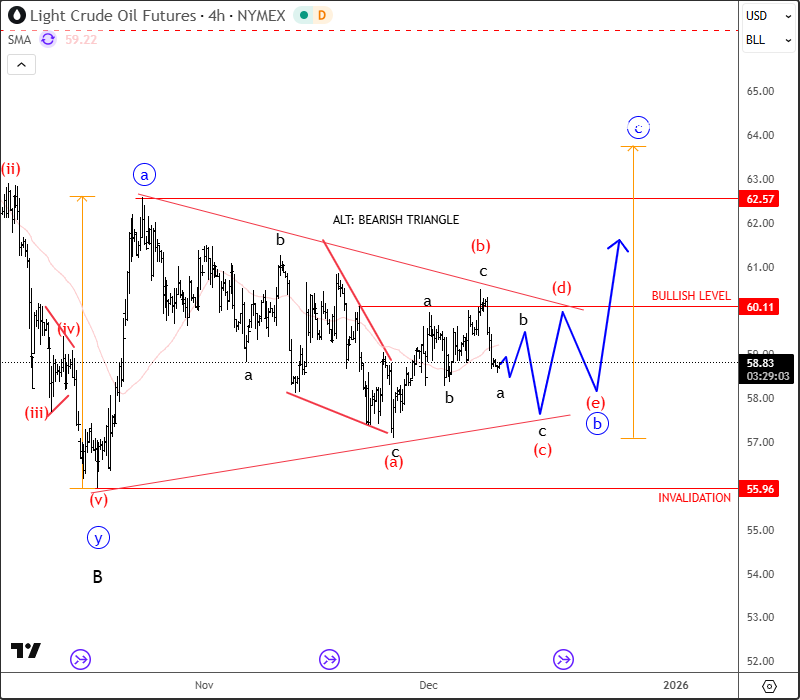
Crude oil made a very strong rebound back in mid-October with an impulsive move of more than 11%, while the current retracement from 62 is very slow, which still suggests a counter-trend movement despite of a drop to 78.6% Fib support levels. We can still see three waves down, but due to the recent three-wave recovery and sharp reversal lower, it seems like it will stay trapped in a triangle formation. It’s ideally an abcde bullish triangle pattern in wave “b” before we may see a bigger recovery for wave “c”, but bullish confirmation is only above upper triangle line and 61 area. Currently, we can see it slowing down within a three-wave abc drop into wave (c), which can retest the lower triangle line.
Alternatively it can be also forming a bearish triangle pattern, but bearish confirmation is only below 56 area.
Become a premium member
Get daily Elliott Wave updates for US Single Stocks, SP500,DAX, GOLD, SILVER, CRUDE, FX, CRYPTO, etc. or apply for unlimited access to the Elliot Wave educational videos.