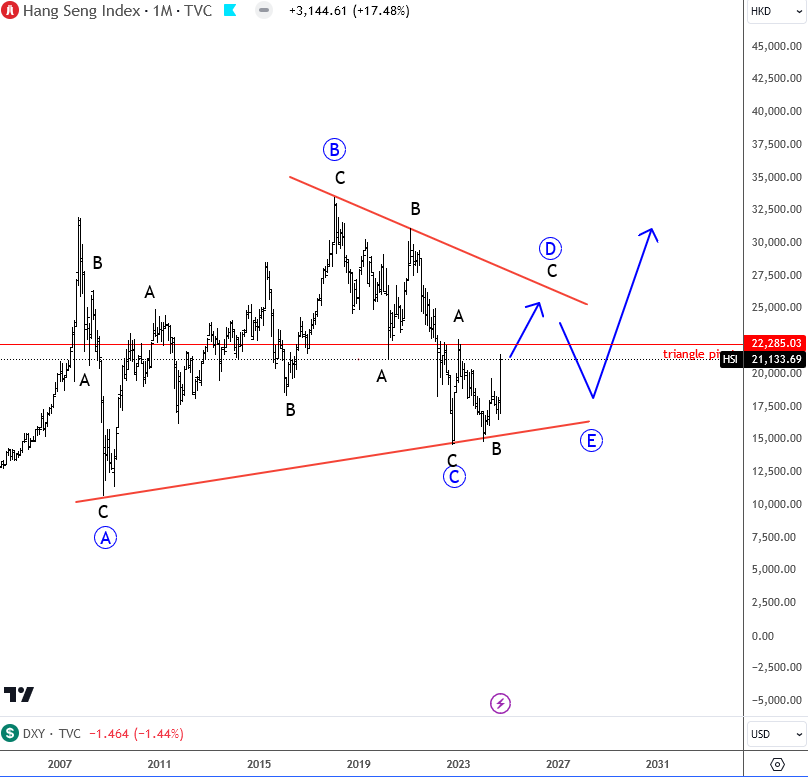
Hang Seng Index with ticker HSI is in new recovery mode as China launches a stimulus package to pull economic growth back towards this year’s roughly 5% target. Looking at the monthly HSI chart, we can see it trading in a three-wave A-B-C rally within wave D of a larger bullish ABCDE triangle pattern, which can now send the price towards the upper triangle line near 25k area before we will see a new wave E slow down.
Become a premium member
Get daily Elliott Wave updates for US Single Stocks, SP500,DAX, GOLD, SILVER, CRUDE, FX, CRYPTO, etc. or apply for unlimited access to the Elliot Wave educational videos.