After some initial recession fears spurred by the NFP report showing higher unemployment (4.3%) at the start of Avugust, stocks have bounced back up as last week’s retail sales data indicates the economy isn’t as bad as feared. CPI figures have also helped stabilize the markets, and with the FED potentially closer to cutting rates in September, the stock market may continue higher.
Now that stocks are back to bullish mode, we can see a strong risk-on sentiment that can push stocks even higher, while USDollar will most likely stay under bearish pressure along with US Yields, which can help Crypto market to stay in the bullish trend.
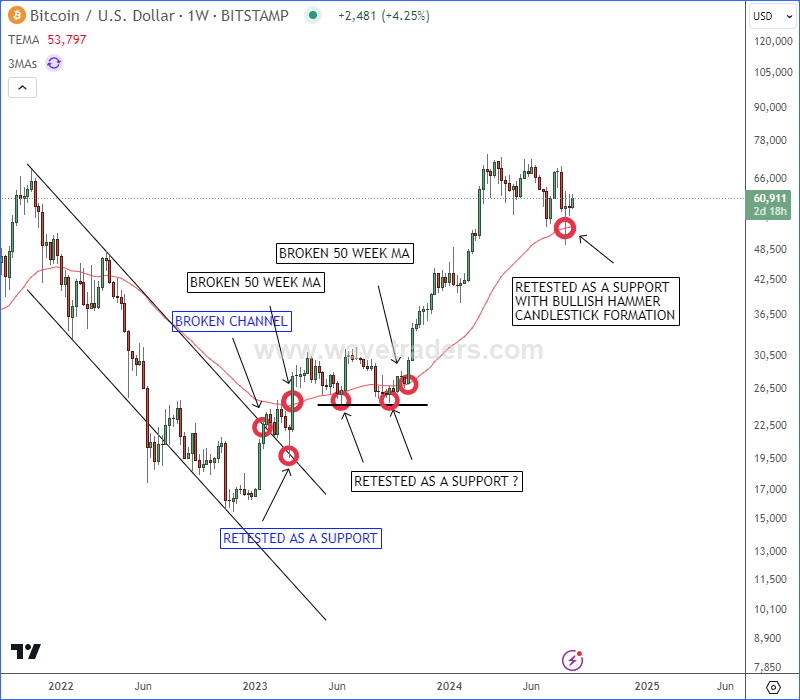
So this time we want to update an interesting weekly BITCOIN technical chart we have been tracking for the last two years. Notice that back in 2023, bitcoin broke out of a downtrend channel and then retested it as a support, followed by a rise above 50-week Moving Average, which interestingly, also held as a support. Since then price turned higher, and start forming some extended structures since beginning of 2024.
Now in the second part of 2024 we got some slow down after touching 80k, but it clearly looks like a corrective and sideways price movement within uptrend, that once again retested 50-week MA support, also with nice bullish hammer candlestick formation. That said, be aware of a bullish continuation into the end of 2024.

Become a premium member
Get daily Elliott Wave updates for US Single Stocks, SP500,DAX, GOLD, SILVER, CRUDE, FX, CRYPTO, etc. or apply for unlimited access to the Elliot Wave educational videos.