USDOLLAR – The Dollar Index Dow Jones chart from FXCM is a basket chart, which was developed by traders for traders allowing you to take advantage of US Dollar appreciation or depreciation with precise tracking and maximum liquidity. The index basket is designed to be as easy to understand as it is to trade. It reflects the change in value of the US dollar measured against a basket of the most liquid currencies in the world: AUSSIE Dollar, EURO, British POUND and Japanese YEN.
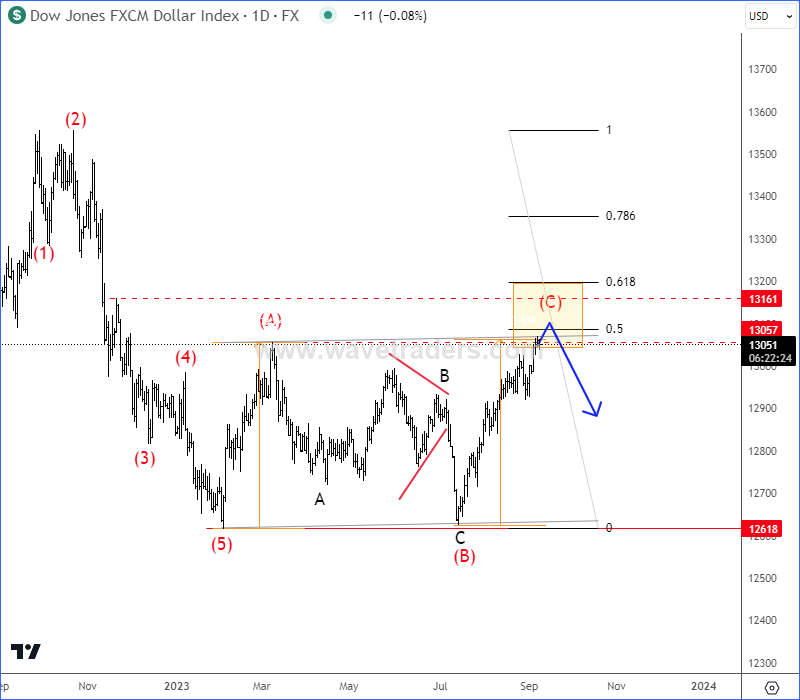
On September 8th we shared a free chart about strong resistance for the USDOLLAR pair, where we mentioned and highlighted wave (C) of an (A)-(B)-(C) flat correction. CLICK HERE

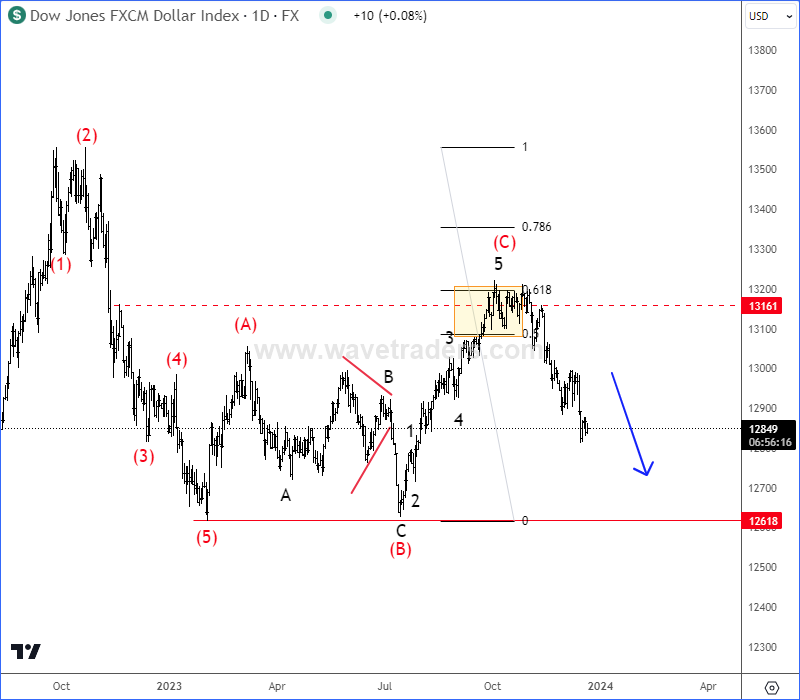
As you can see today, USDOLLAR is turning sharply and impulsively down from projected resistance, which means that bears are back in play and we can expect more weakness back to the yearly lows, just be aware of short-term corrective rallies.

In case if you missed, you can check our latest video market update HERE.