Hello traders!
USdollar Index with ticker DXY is in a massive recovery and it’s unfolding a five-wave bullish cycle within higher degree wave (C) of a larger (A)(B)(C) correction as expected. We talked a lot about that in the past month, we also shared a tweet, when we spotted wave 4 correction within uptrend that can send the the price higher for wave 5.
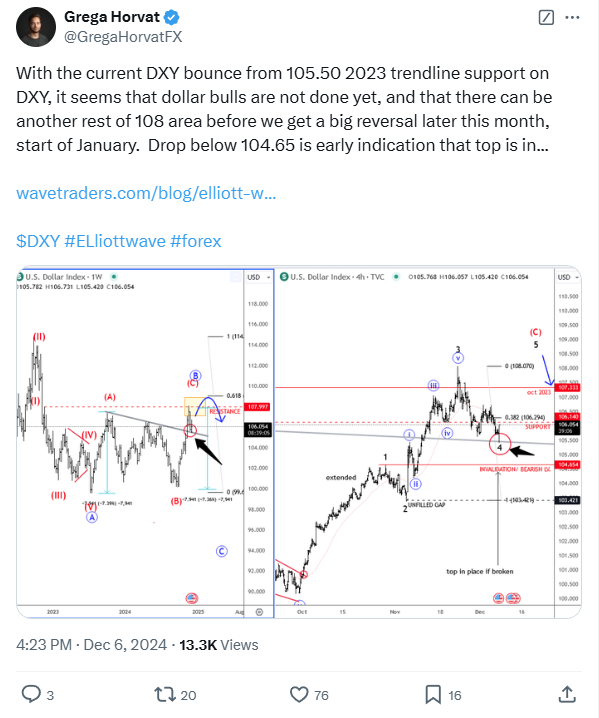
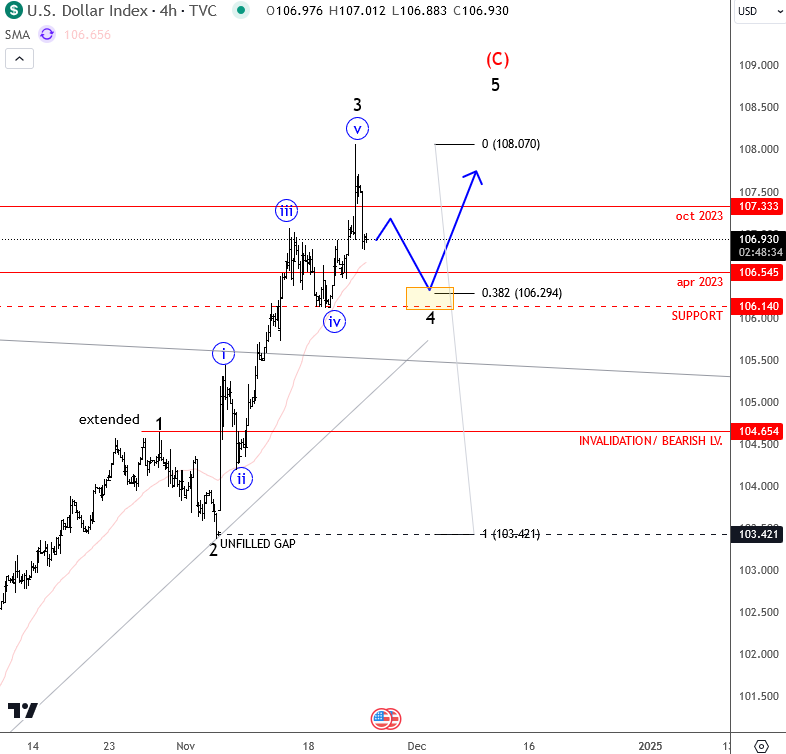
Let’s start from November 25th, when we noticed a completed subwave “v” of a lower degree impulse within wave 3, which caused a new drop, but we pointed out it’s only a wave 4 correction that can retest the support around ideal 38,2% Fibo. retracement.
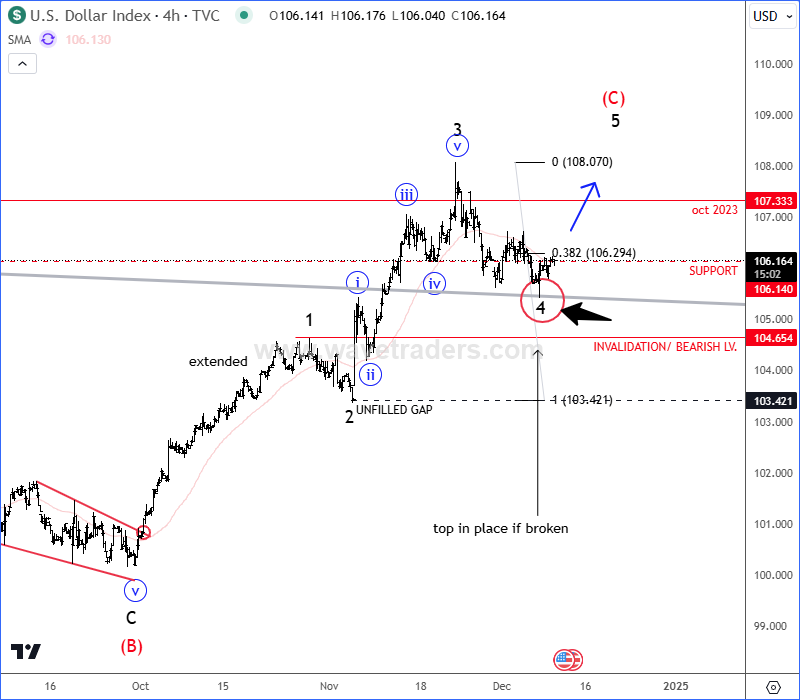
Later on December 10, DXY made a nice corrective pullback into projected support area, from where we expected a bounce and bullish continuation for wave 5 of (C).
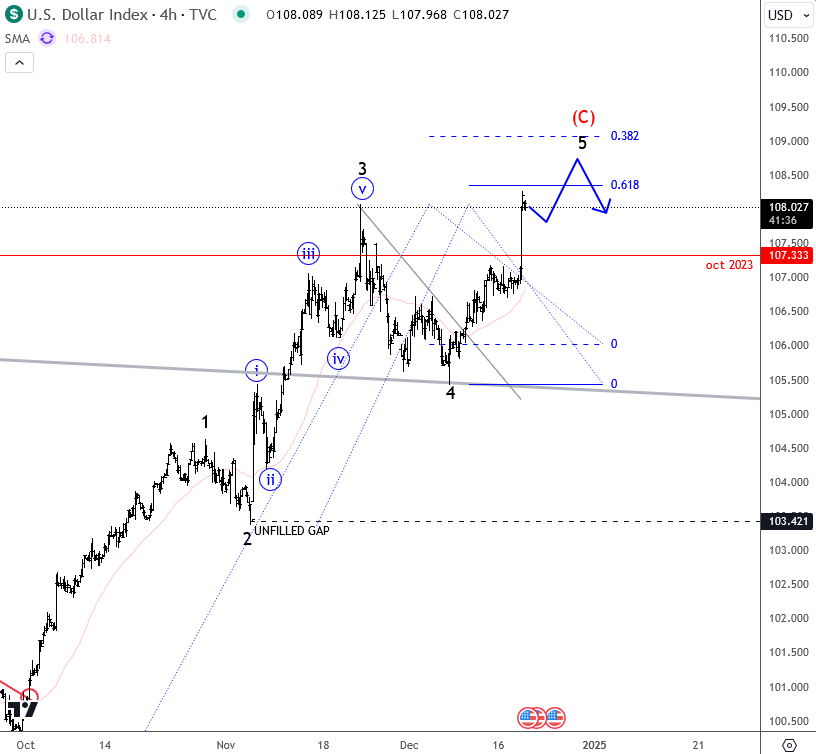
As you can see today on December 19th, DXY is coming back to highs for the final wave 5 of (C), so we should be now aware of limited upside and reversal down, but maybe barely in 2025, as there can be still space for slightly higher resistance up to 109 area.
Become a premium member
Get daily Elliott Wave updates for US Single Stocks, SP500,DAX, GOLD, SILVER, CRUDE, FX, CRYPTO, etc. or apply for unlimited access to the Elliot Wave educational videos.