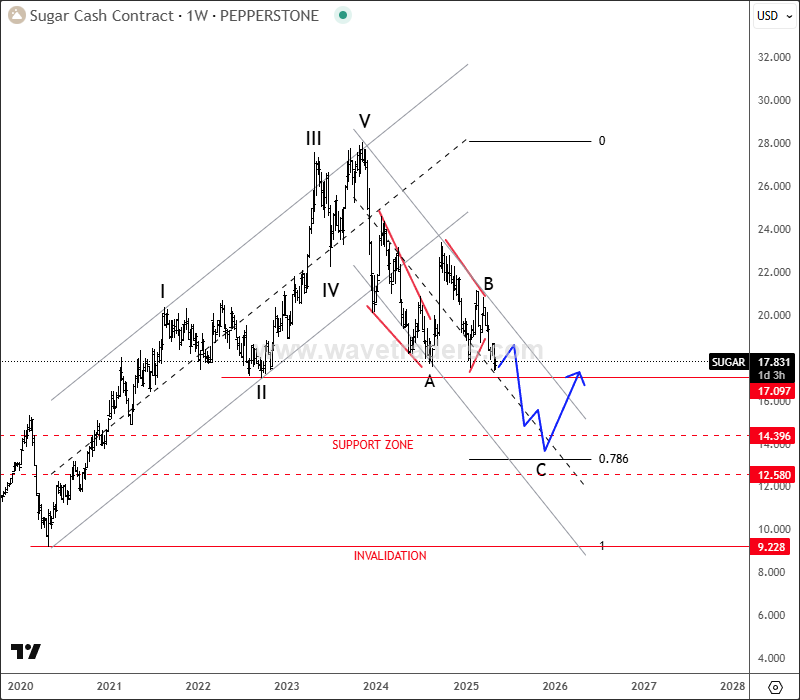
Sugar has been trading lower since 2023 when we spotted final wave V of an impulse on the weekly chart. So from Elliott wave perspective, it’s trading in a multi-year higher degree ABC corrective decline, where wave C can drop the price even down to 78,6% Fibonnaci retracement and 14-12 support area before bulls show up again.
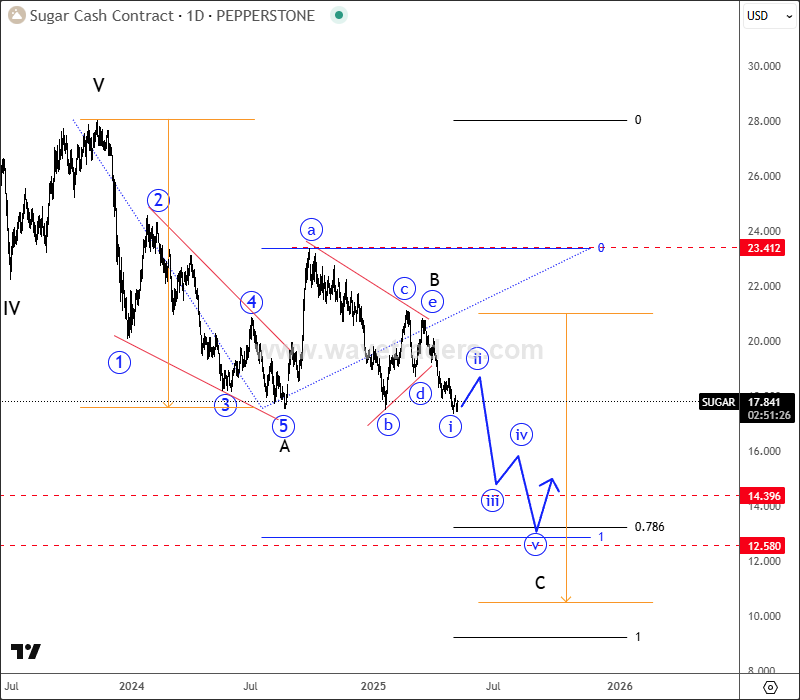
The reason why Sugar can go lower is a short-term daily Elliott wave structure, where we see a five-wave leading diagonal formation into wave A, followed by a bearish abcde triangle pattern in wave B. It can now extend the decline within wave C towards 14 -12 area which can be made by a lower-degree five-wave bearish cycle, just be aware of shor-term pullbacks.
Become a premium member
Get daily Elliott Wave updates for US Single Stocks, SP500,DAX, GOLD, SILVER, CRUDE, FX, CRYPTO, etc. or apply for unlimited access to the Elliot Wave educational videos.