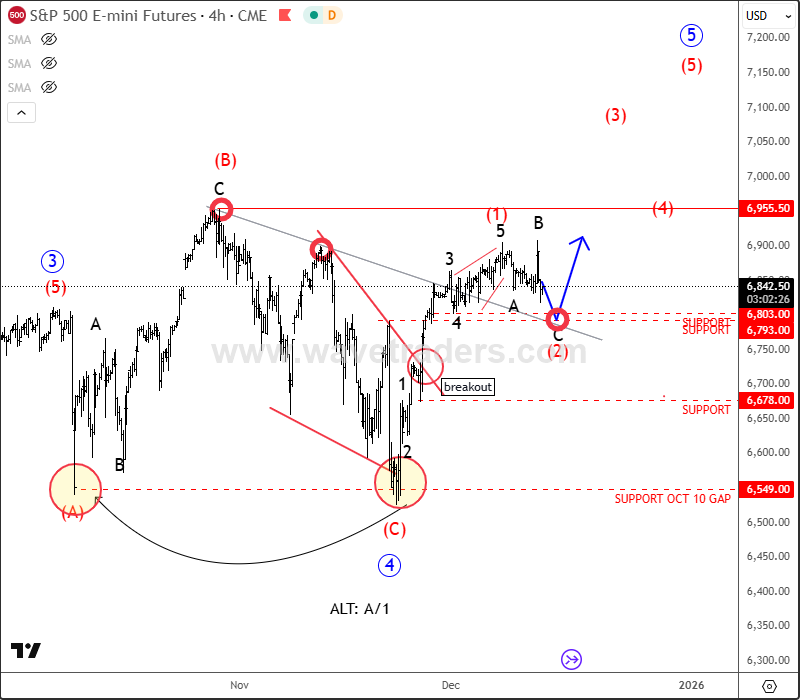
S&P 500 has made a very nice retracement recently; in fact for almost the whole November we have seen a pullback of around 5 to 6%, which is quite a lot for the S&P 500, and what is really important is that the market has stopped around the 6500 area, which basically goes back to October 10th when we saw a massive sell-off on that Friday when Trump threatened with new tariffs on China. But afterwards, as you can see, the market recovered, so it looks like a very beautiful rebound from that zone with impulsive characteristics, even beyond the diagonal and trendline resistance lines. This likely confirms that bulls are ready to resume higher into a potential fifth wave, which can be made by a new lower-degree five-wave bullish cycle.
After the recent FED meeting, we can see it making an ABC irregular flat correction in wave (2) that can find the support around 6800 area, so soon be aware of a bullish resumption within wave (3).
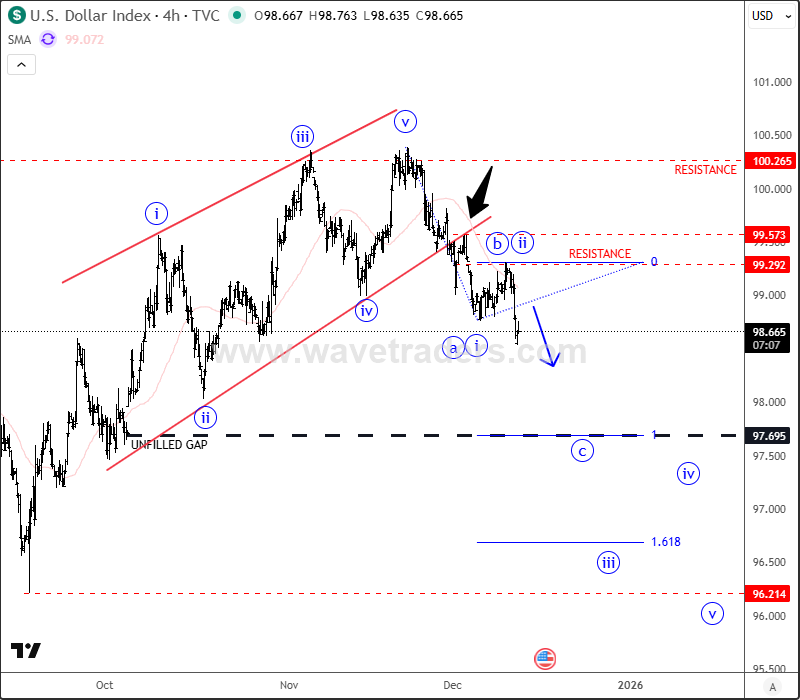
The reason why stocks can stay in the bullish trend is bearish USDollar Index – DXY. DXY made higher highs and higher swing lows from September when the Fed cut rates, with stock markets beeing under pressure since expectations for further cuts have decreased. But this has changed recently, and what’s really important now is that despite this recovery from September lows, we still see an overlapping wave structure, so it can easily be a five-wave movement that can even represent a diagonal in wave C, meaning a reversal pattern that could send prices lower now, after completion of the higher-degree wave four. It can be also leading diagonal, but in both cases we would expect a minimum three-leg a/i-b/ii-c/iii decline that seems underway right now. Broken red trendline support makes room for 97.70 gap within wave c or iii after the recent wave b/ii pullback.
For more, you can visit us at wavetraders.com, where you can enjoy all of our analysis on
FX, Stocks, Metals, Crypto etc.
Become a premium member
Get daily Elliott Wave updates for US Single Stocks, SP500,DAX, GOLD, SILVER, CRUDE, FX, CRYPTO, etc. or apply for unlimited access to the Elliot Wave educational videos.