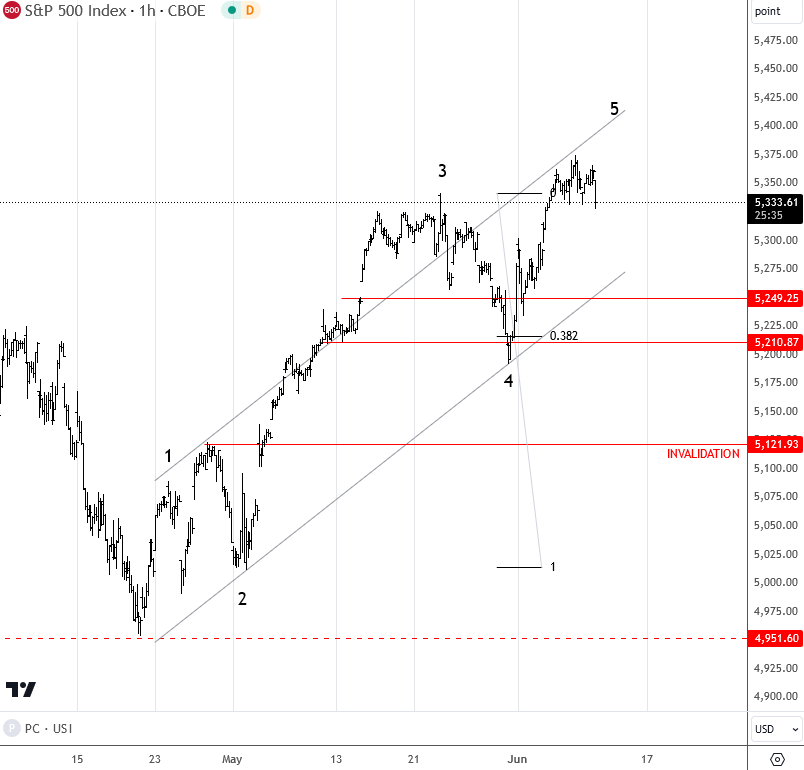
Hey Traders and welcome to another free update, this time on the S&P 500, which is trading at new highs ahead of the very important US CPI data and the Fed interest rate decision tomorrow. As you know, we’ve been highlighting a bullish pattern on the S&P 500 throughout May. Specifically, we focused on the perfect 4th wave retracement that unfolded down to the 5,210 support on June 3rd. From there, we have seen a strong reaction to the upside, with prices now trading at new highs within the 5th wave.
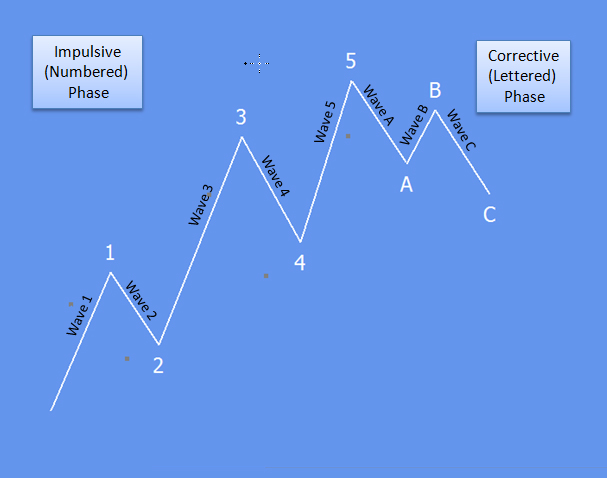
For those unfamiliar with the Elliott Wave principle, the current question is where the market will go from here. It’s essential to focus on simple structures and not overcomplicate things. When we can count five waves up, we should be aware that the current trend might be nearing its end. The Elliott Wave works in an eight-wave pattern: five waves in one direction, followed by three waves in the opposite direction.
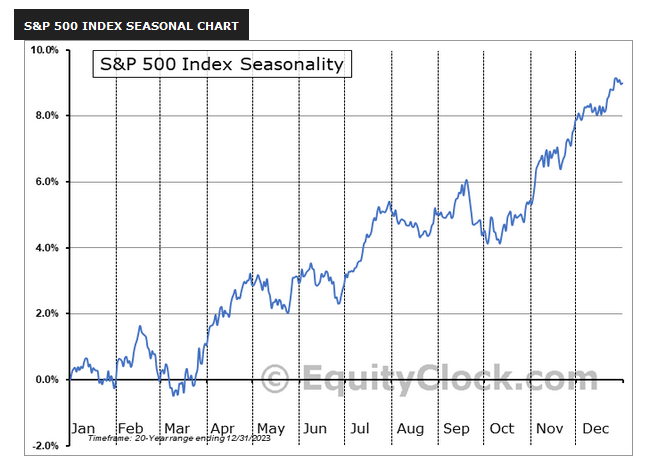
If we are correct, the current trend could soon slow down, leading to a new correction. A potential reversal level to watch is around 5,400, which aligns with the upper side of the current impulse channel. Additionally, considering the S&P 500’s seasonal chart, we notice that markets often pull back or move sideways in June, especially after a strong May. This seasonal trend supports the Elliott Wave analysis, suggesting a possible pause or correction.
In summary, with five waves up and summer approaching, there might be some position adjustments that impact prices. Therefore, stocks could slow down before resuming a stronger uptrend after summer or during the election period.
Hope you enjoyed this article. For more similar updates, check out our premium services and the latest webinar recording here.
Grega


Become a premium member
Get daily Elliott Wave updates for US Single Stocks, SP500,DAX, GOLD, SILVER, CRUDE, FX, CRYPTO, etc. or apply for unlimited access to the Elliot Wave educational videos.