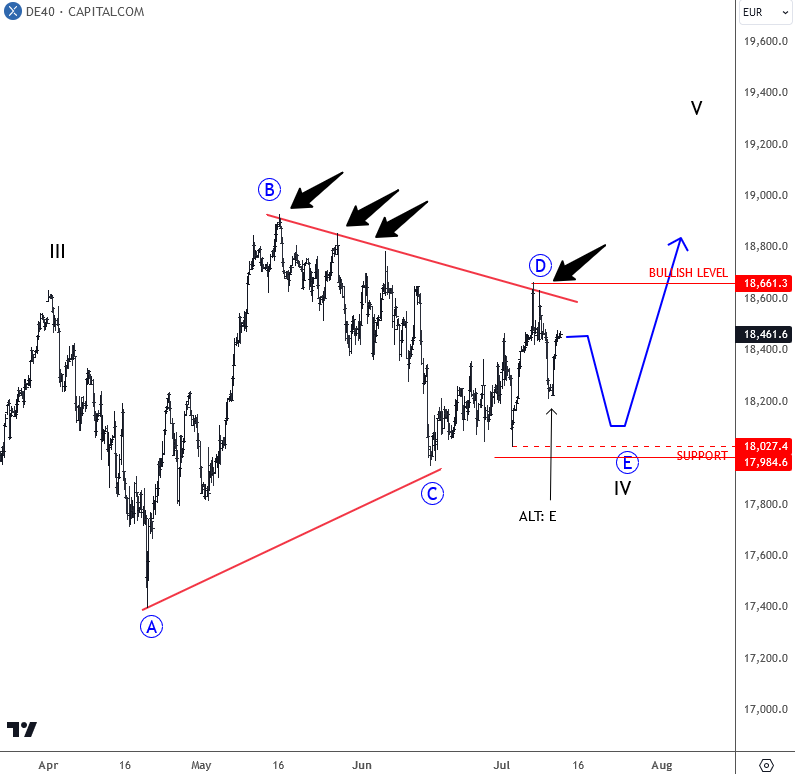
DAX made some nice deep pullback in the last few weeks; so far with overlapping price action which can still be a corrective wave IV within an ongoing five-wave bullish impulse. It’s ideally forming a bullish running triangle pattern that can be coming to an end soon. Looking at the 4-hour chart, we can actually see it trading in final wave E, but until we see a break above 18661 bullish confirmation level, wave E can also retest lower support levels around 18000 area before a bullish breakout for wave V.

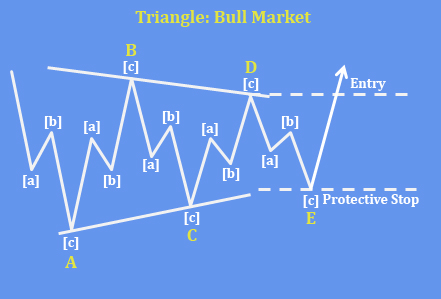
A triangle appears to reflect a balance of forces, causing a sideways movement that is usually associated with decreasing volume and volatility. The triangle pattern contains five overlapping waves that subdivide 3-3-3-3-3 and are labeled A-B-C-D-E. The running triangle is a region of horizontal price movement, a consolidation of a prior move, and it is composed of “threes.” That means each of the A-B-C-D-E waves have three subwaves. The triangle pattern is generally categorized as a continuation pattern, meaning that after the pattern completes, it’s assumed that the price will continue in the trend direction it was moving before the pattern appeared. However, triangles also indicate that the final leg is coming before a reversal and that’s why triangles are labeled in wave B, wave X or wave 4.

For a detailed view and more analysis like this, you may want to watch below our recording of a live webinar streamed on July 09 2024:
Become a premium member
Get daily Elliott Wave updates for US Single Stocks, SP500,DAX, GOLD, SILVER, CRUDE, FX, CRYPTO, etc. or apply for unlimited access to the Elliot Wave educational videos.
Bearish Tether Dominance Could Be Supportive For Bitcoin. Check our free chart HERE.