Gold has been one of the most dynamic assets in the markets recently, and getting ahead of its price action is a challenge for most traders. However, our premium members had an edge, thanks to a detailed Elliott Wave analysis that precisely forecasted the pullback and subsequent rally.
Identifying the Pullback: Wave Four Unfolds
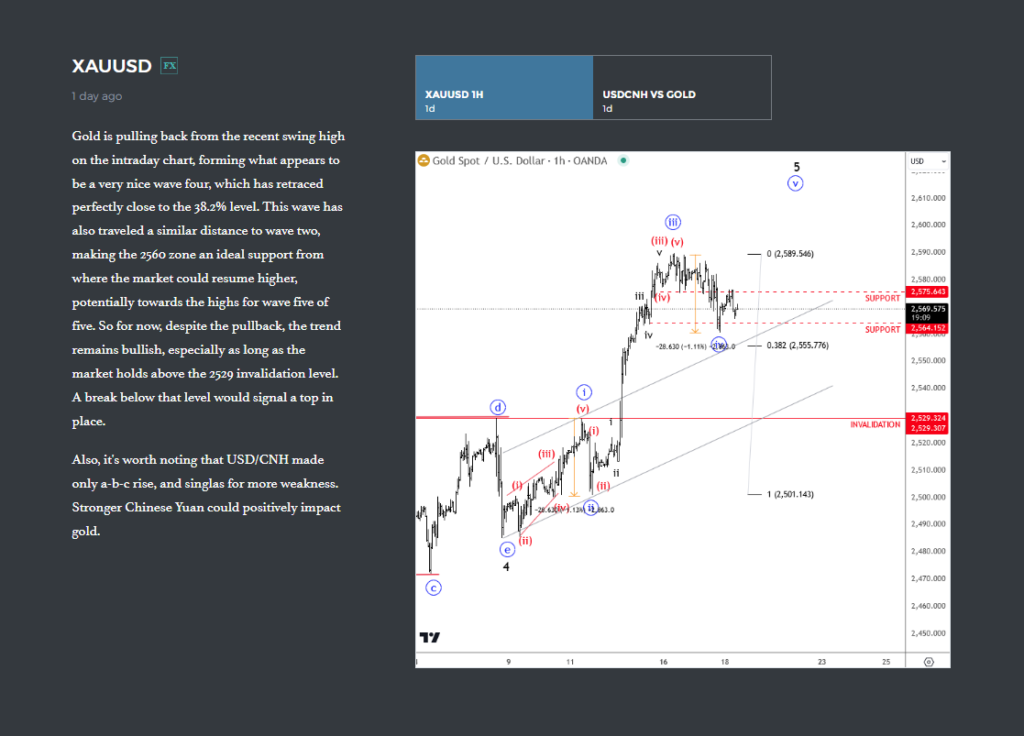
Our analysis started with identifying a potential pullback in gold after the recent swing high. We observed that gold was forming what appeared to be wave four of a larger Elliott Wave structure. This wave was crucial because it often retraces to a certain Fibonacci level, setting up a potential opportunity for the next leg higher.
In this case, the pullback retraced close to the 38.2% Fibonacci level, a common target for wave Four corrections. This alignment gave us high confidence that gold would hold above the 2560 zone, offering a strong support level where buyers could re-enter the market.
Before the FED

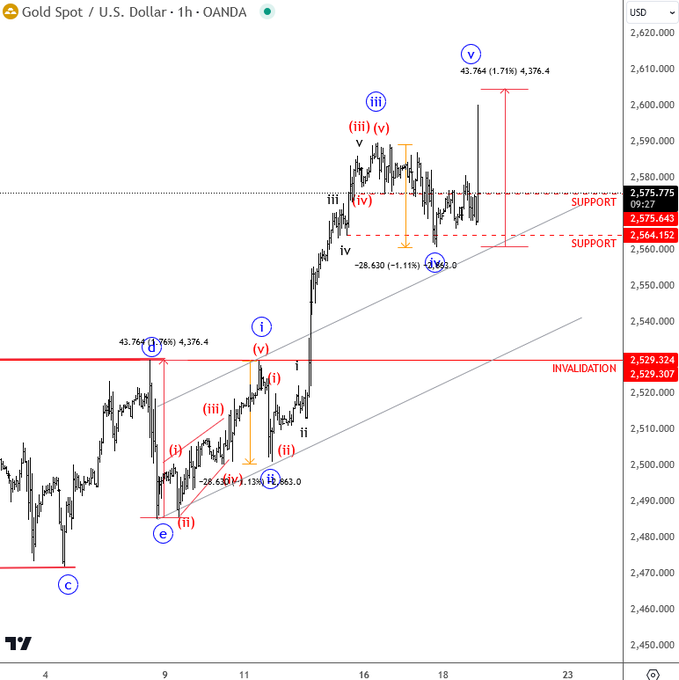
The Bounce: Wave Five Targets Higher
Following the pullback, our projection for a Wave Five rally began to take shape. Gold moved exactly as anticipated, holding support at the 2560 zone and continuing its bullish momentum. As long as the market stayed above the 2529 invalidation level, we remained confident that a new high was likely.
Wave Five in Elliott Wave theory typically signals the last leg of the trend, but the question remains; is gold toping out, or did the wave count change?
To answer the question Join Us Today
Don’t miss out on the next big move! Join our premium community and gain access to accurate market insights and detailed technical analysis, just like the gold forecast we nailed. Stay ahead of the markets with the power of Elliott Wave.
Become a premium member
Get daily Elliott Wave updates for some major Digital currencies, FIAT currency markets, major stock indexes, gold, silver, crude etc. or apply for unlimited access to the Elliot Wave educational videos.
After the FED
