Ethereum appears to be under sustained selling pressure on the daily chart, with price action suggesting the development of a five-wave bearish impulse. If this structure continues to unfold, Ethereum could be heading back toward the $1300 support area — or even lower — as it currently trades within wave “v” of wave 3. This indicates the potential for more weakness in the weeks ahead.
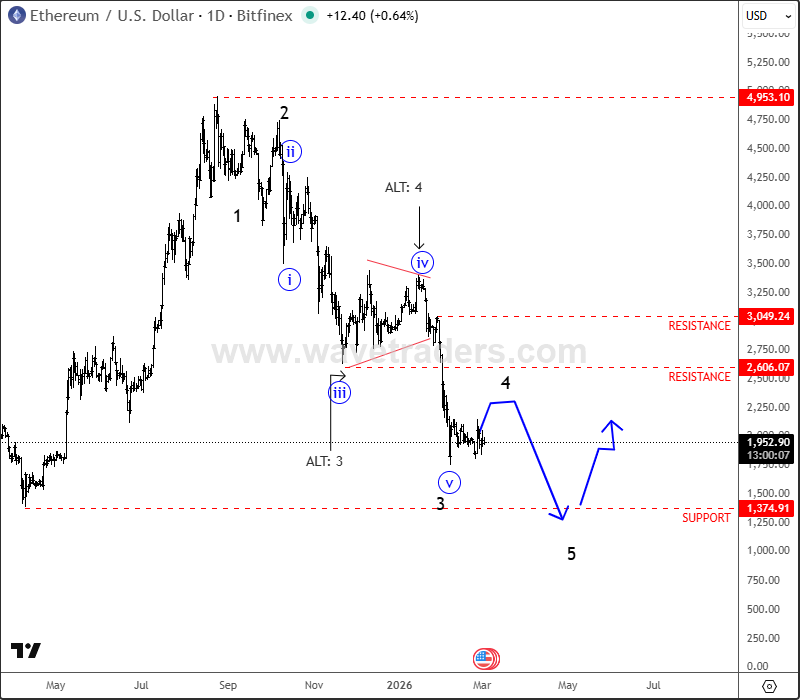
However, traders should remain alert for a possible wave 4 corrective pullback following the completion of five subwaves down in January. This corrective move could bring a temporary recovery, especially as Ethereum has recently broken out of a bearish channel, which often signals a relief rally or consolidation phase.
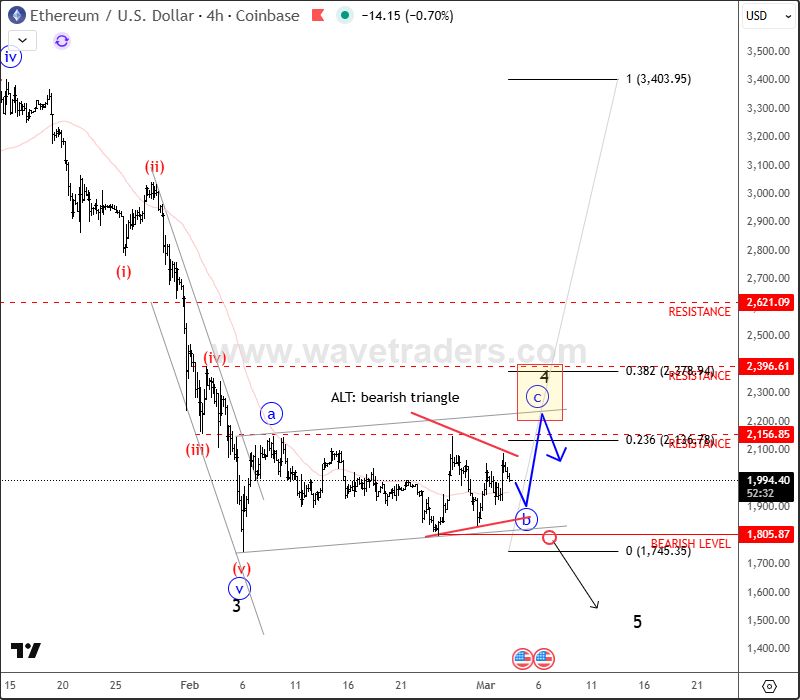
That said, wave 4 corrections are notoriously unpredictable in structure and can take various forms, meaning any upside should not be mistaken for a full trend reversal. A common scenario is an abc correction, where wave “b” — potentially forming a bullish triangle — could be followed by another leg up into wave “c”. This final leg could push prices into the $2200–$2300 resistance zone.
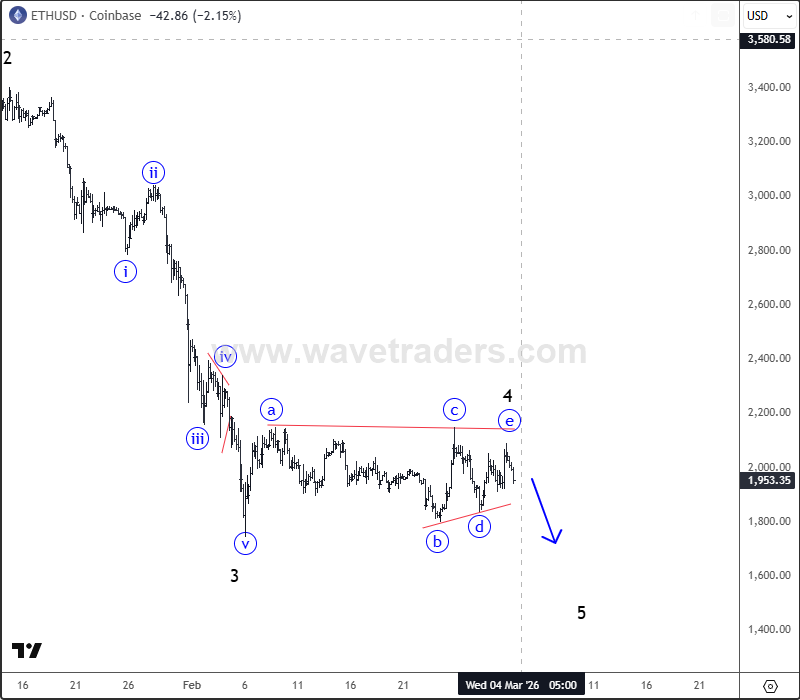
Alternatively, if wave 4 develops as a bearish triangle, the market could remain under pressure, with the pattern ultimately breaking lower and extending the decline directly into wave 5, potentially pushing Ethereum below the $1300 level.
In either case, traders should remain cautious and consider both bullish and bearish scenarios as this complex correction unfolds.
Become a premium member
Get daily Elliott Wave updates for US Single Stocks, SP500,DAX, GOLD, SILVER, CRUDE, FX, CRYPTO, etc. or apply for unlimited access to the Elliot Wave educational videos.