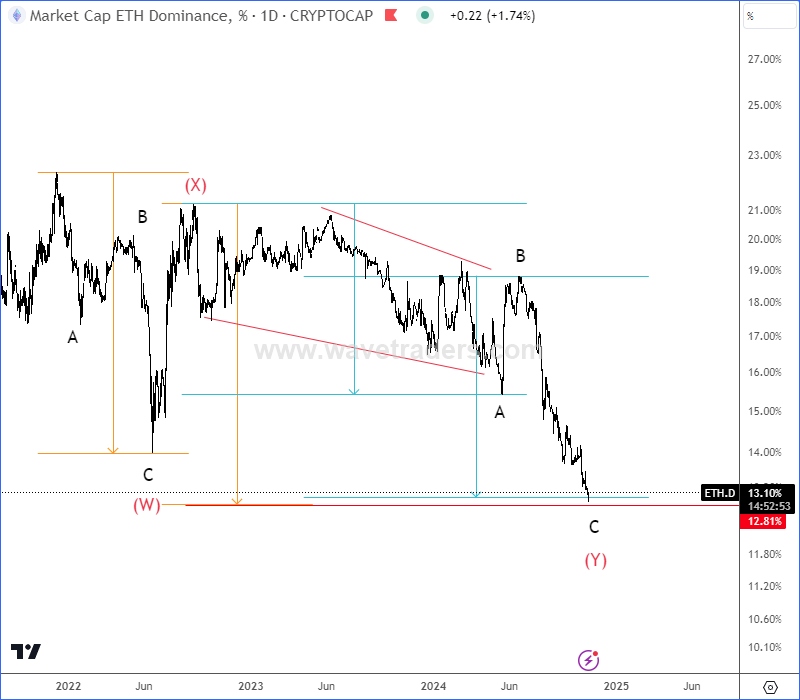
If we take a look at Ethereum.dominance chart with ticker ETH.D, we can see it approaching interesting and strong support area for wave C of (Y) with equal wave length of waves A=C and (W)=(Y) that can belong to a complex (W)-(X)-(Y) corrective setback, so be aware of bounce and recovery, which can recover the Ethereum price.

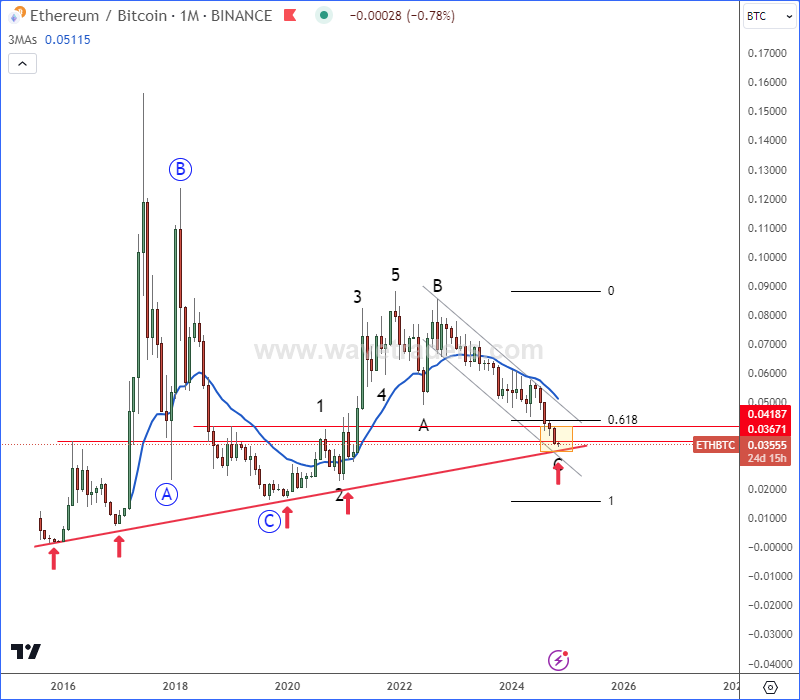
Considering that Ethereum dominance is nearing strong support while it’s finishing a complex W-X-Y correction, we should also keep an eye on the weekly ETHBTC chart, which is also trading at strong weekly trendline within a three-wave A-B-C correction that can rebound the price, where Ethereum may start outperforming Bitcoin.

Is Ethereum about to rally and to follow Bitcoin in the current bullish Crypto market?
For a detailed view, visit us and become a member of www.wavetraders.com
Become a premium member
Get daily Elliott Wave updates for US Single Stocks, SP500,DAX, GOLD, SILVER, CRUDE, FX, CRYPTO, etc. or apply for unlimited access to the Elliot Wave educational videos.