We talked about DXY on September 20. We also shared an article, where we mentioned and highlighted that it’s approaching temporary support within an ending diagonal (wedge) pattern within wave “v”.
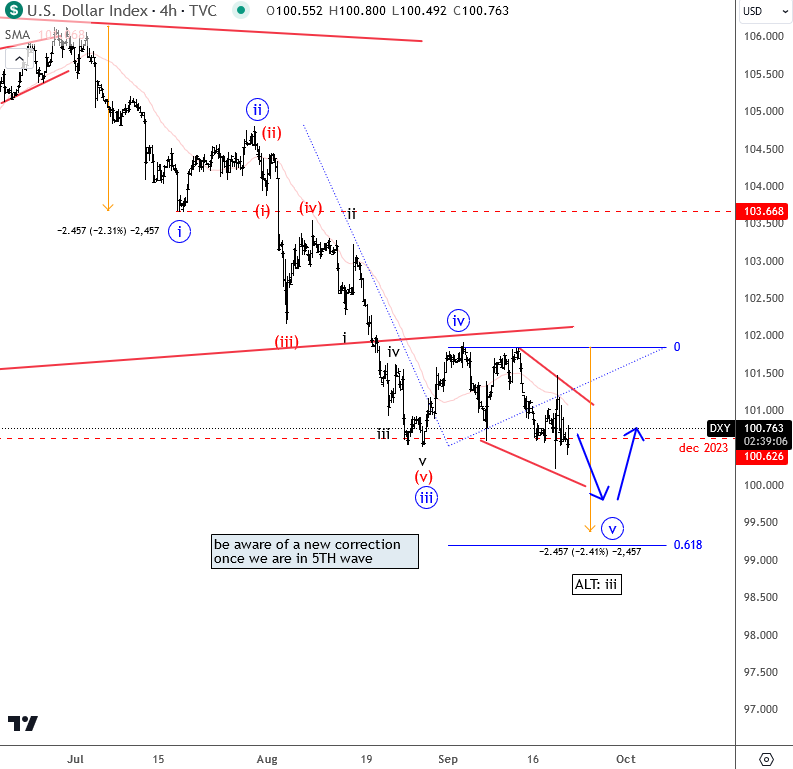
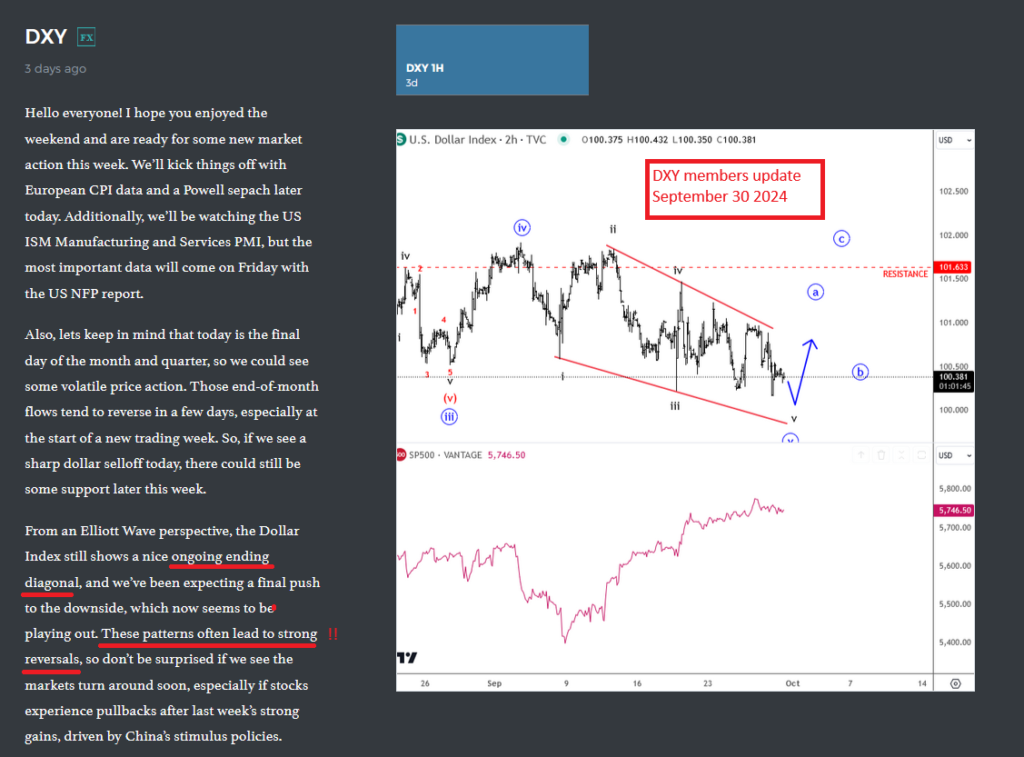
At the end of September we also shared an intraday hourly chart with our members, where we pointed that it’s in final stages of subwave v of the wedge pattern within wave “v” and such patterns usually cause a strong reversal.
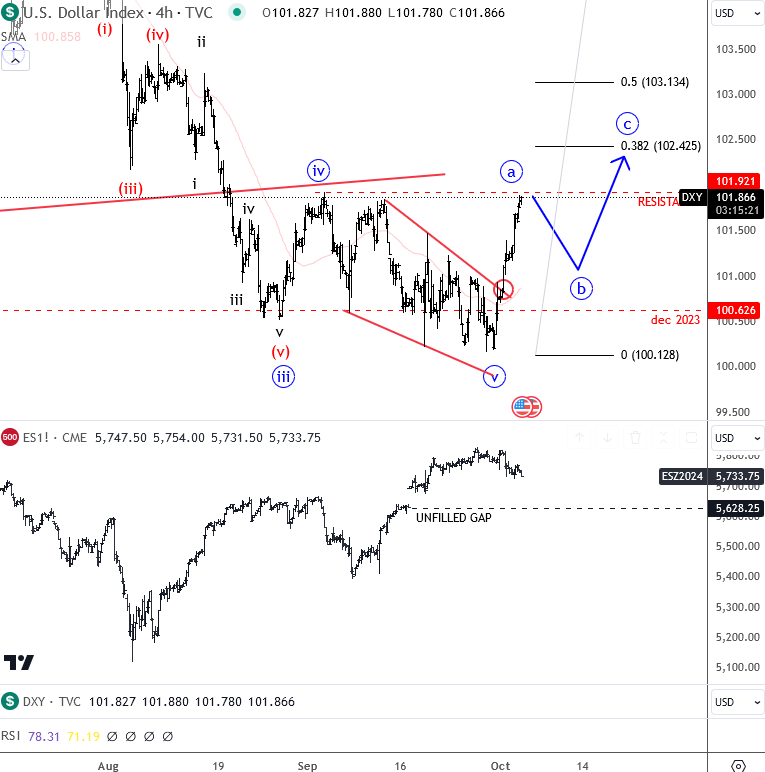
As you can see today on October 03, DXY is coming sharply up after a completed wedge pattern that can be wave “a” and it could lead to a three-wave a-b-c recovery towards 102 – 103 resistance area for wave “c”, just watch out on wave “b” pullback.
Become a premium member
Get daily Elliott Wave updates for US Single Stocks, SP500,DAX, GOLD, SILVER, CRUDE, FX, CRYPTO, etc. or apply for unlimited access to the Elliot Wave educational videos.