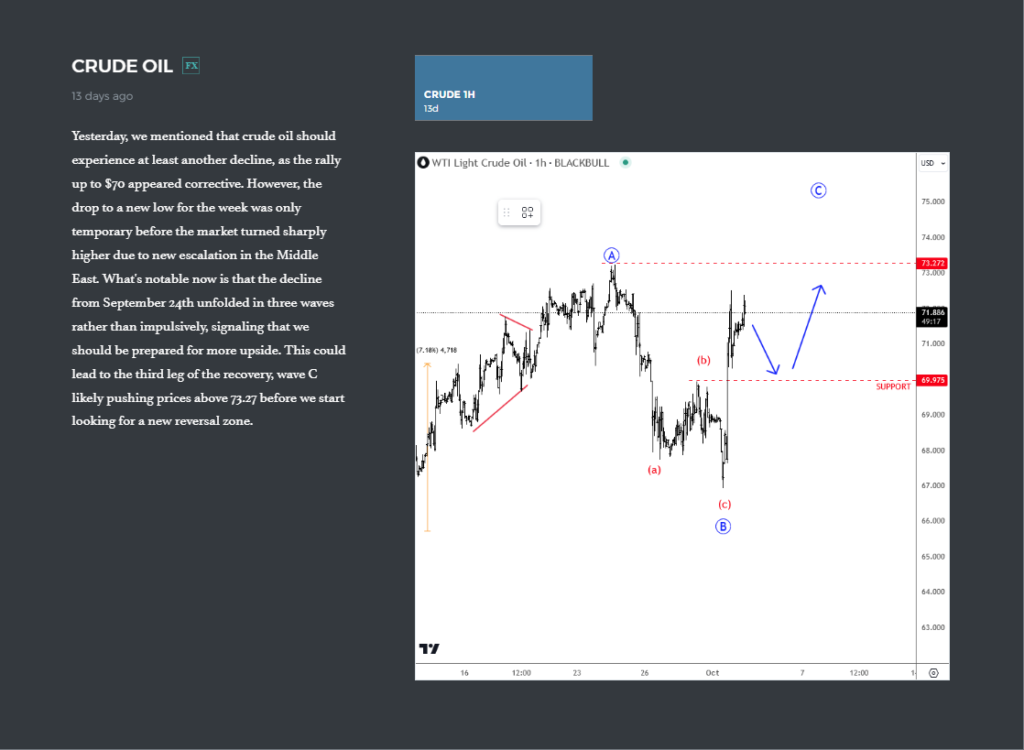
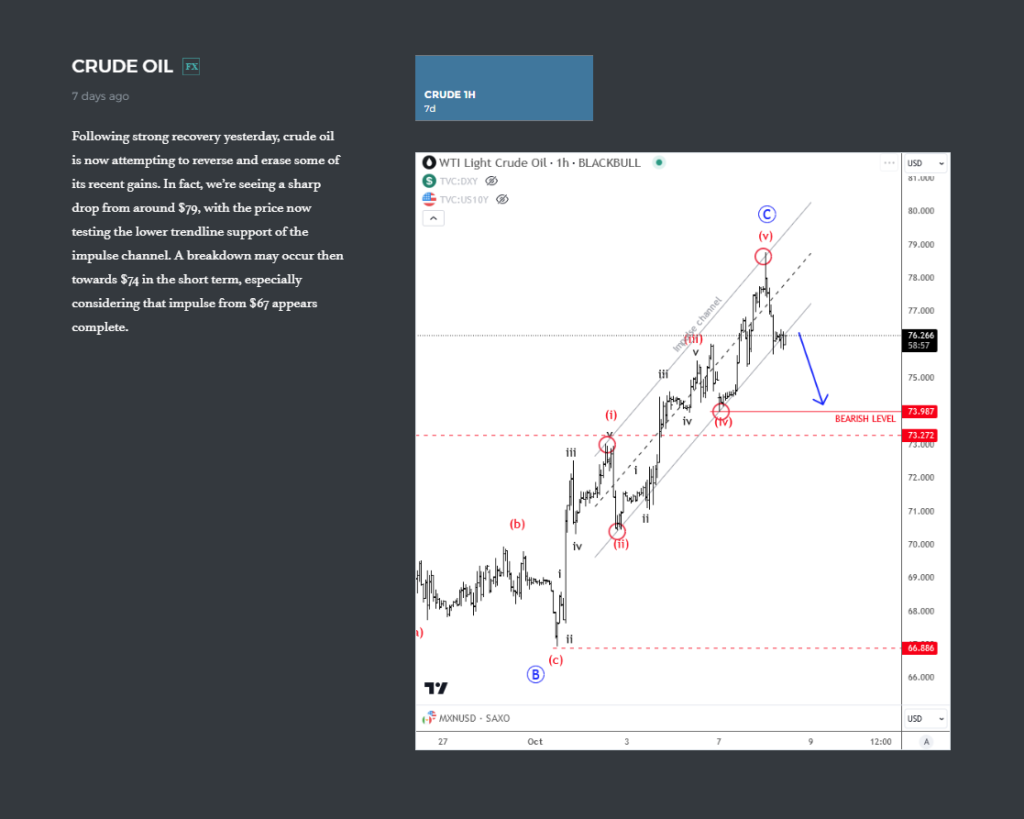
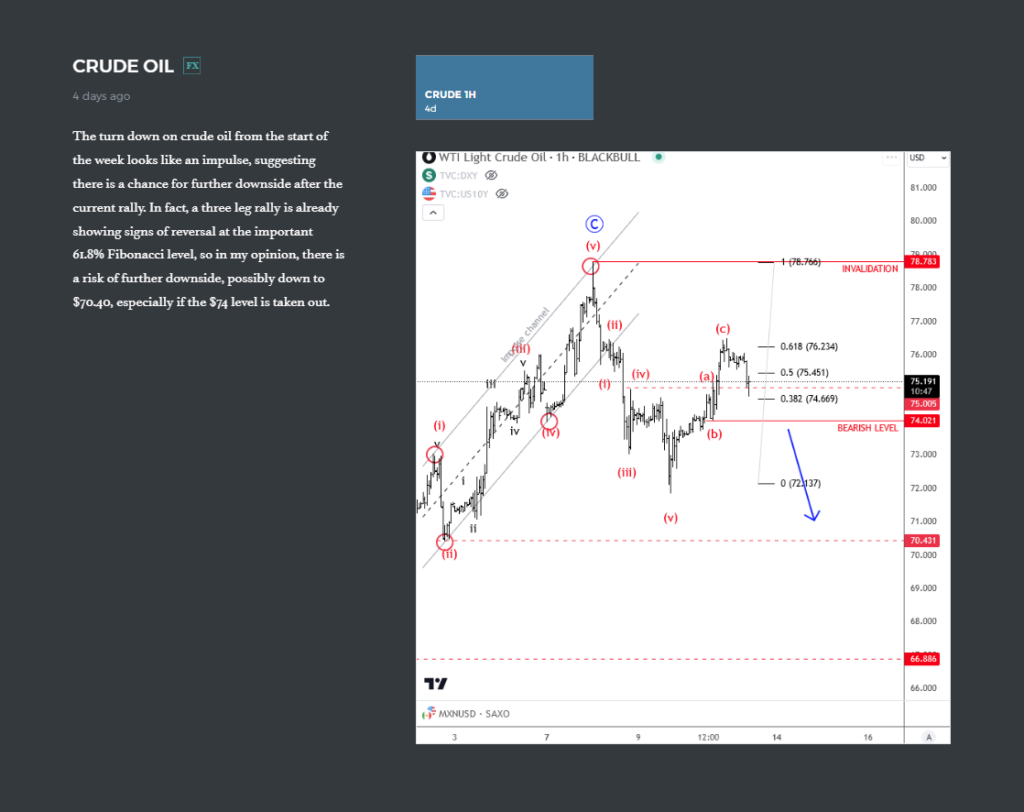
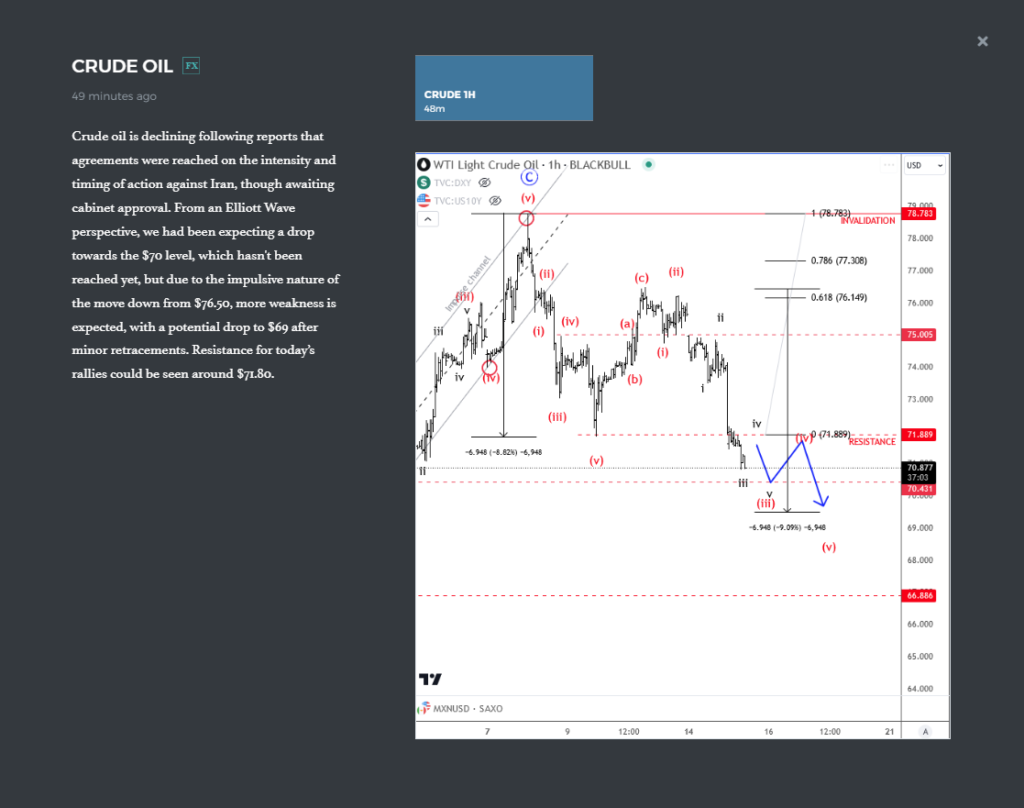
In this article, we will share an educational piece about crude oil and its movements on an intraday basis using Elliott Wave Theory. We believe that Elliott Wave Theory is particularly useful for analyzing crude oil, as it tracks market sentiment and trader psychology. This is especially relevant for assets like crude oil, which are highly sensitive to geopolitical events. Crude oil prices are often impacted by unexpected developments, and during such times, the majority of traders tend to make decisions driven by their emotions and subjective reactions rather than objective analysis.

As you can see, a week later on October 08 price was well above $73 as expected, but more important we spotted a strong resistance the for wave C at 79 area, because of a completed five-wave cycle of the lower degree. So Elliott wave structure was pointing down.

Then on October 11, Crude oil made an impulsive intraday drop from resistance, followed by an a-b-c corrective setbac. This was very important bearish formation, so we immediately called for more downside.

As you can see today on October 15, Crude oil resumes its weakness within a new five-wave bearish impulse, down to 70.00.
The question is whats next will crude bottom, or move even lower? To find more of our analysis, check our premium services.
Become a premium member
Get daily Elliott Wave updates for US Single Stocks, SP500,DAX, GOLD, SILVER, CRUDE, FX, CRYPTO, etc. or apply for unlimited access to the Elliot Wave educational videos.
