Hello Crypto traders!
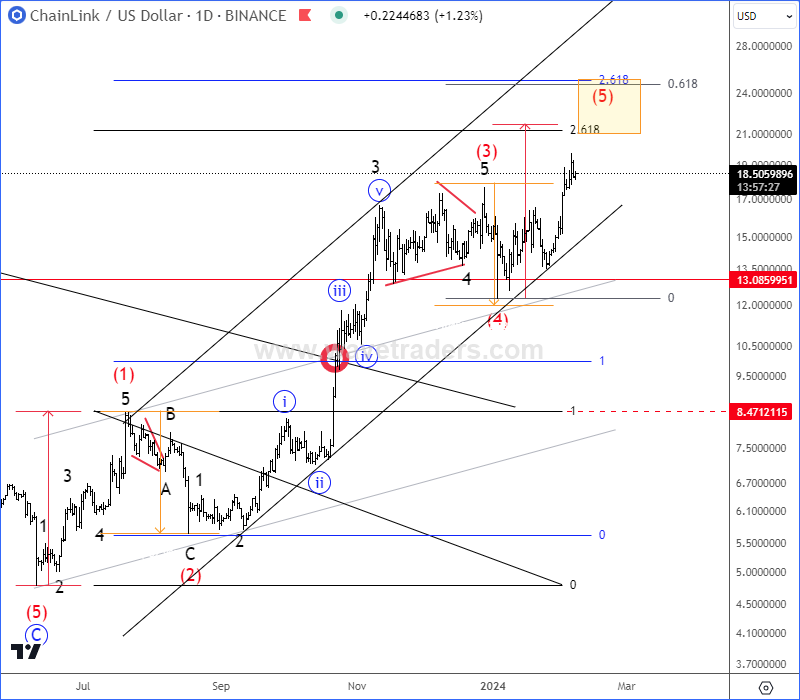
ChainLink with ticker LINKUSD is moving nicely as anticipated for the last year, so we want to share an educational article on how we have been tracking it. Here is the free chart from January of 26, when we were tracking wave (4) correction within an ongoing five-wave bullish cycle.
On February 07 we actually spotted final stages of wave (5) of an impulse from the lows, so we warned about an upcoming corrective decline from around 20 area.

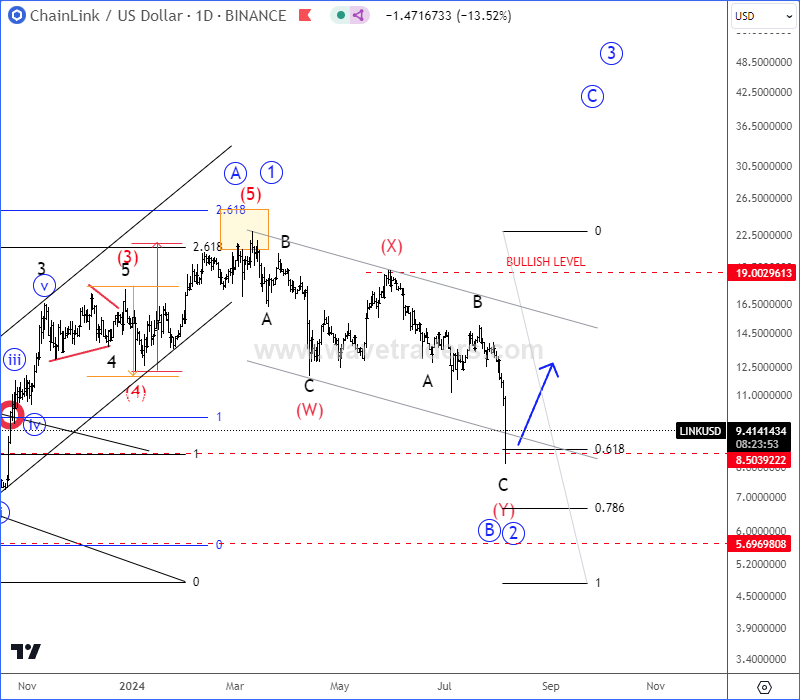
Later on August 05, LINKUSD slowed down for a corrective setback as expected, which turned out as a deep and complex (W)-(X)-(Y) correction within higher degree wave B/2. We pointed out about strong 61,8% Fibonacci retracement and 8 support area, from where we anticipated a continuation higher for wave C or 3.

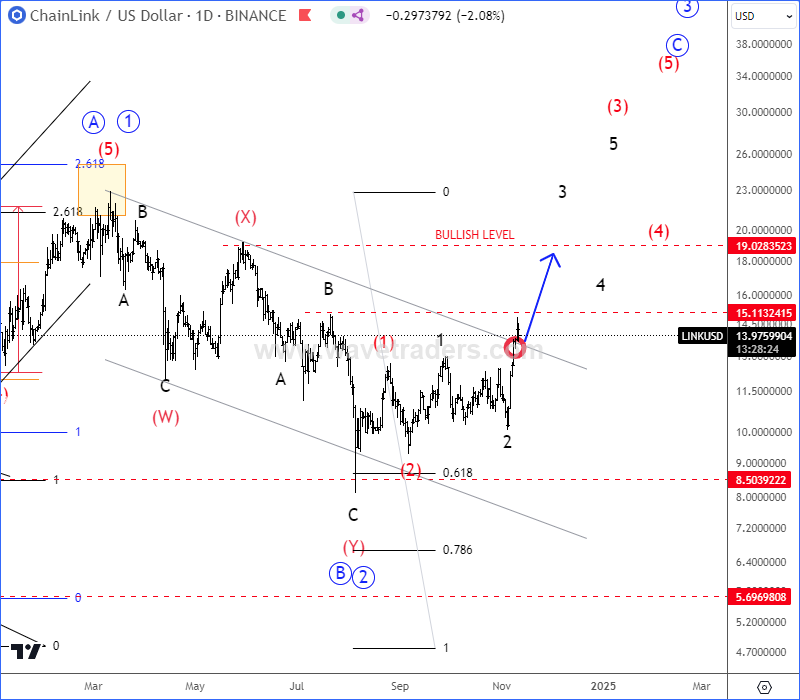
Later then on November 11, Chainlink finally started to recover again back above channel resistance line, which was a confirmation for a bullish continuation within higher degree wave C or 3, so we were tracking a lower degree subwave 3 of a new five-wave bullish impulse that can send the price back to March 2024 highs.

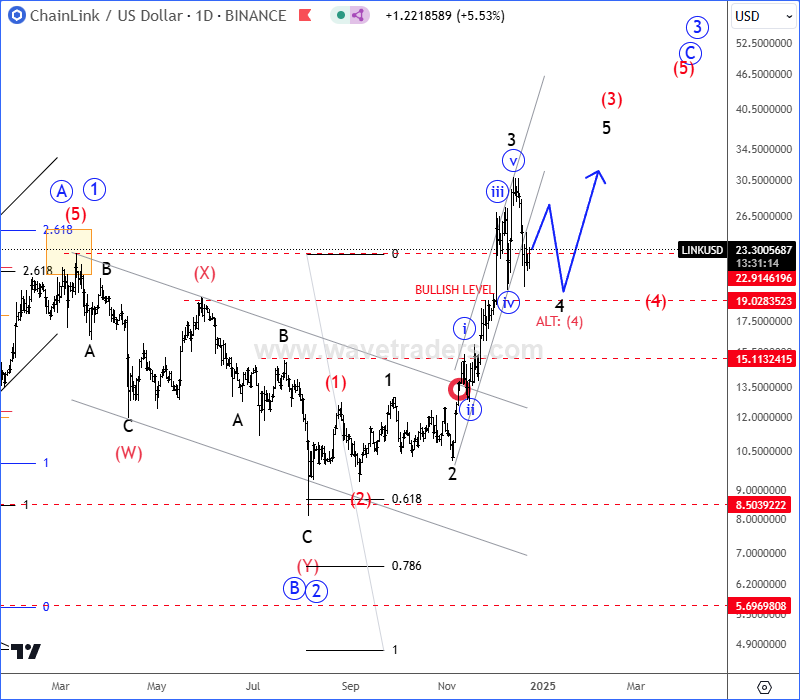
As you can see today on December 23, it’s already back to March 2024 highs, but it remains in a projected strong five-wave bullish impulse, so after current wave 4 pullback that can retest 20 – 19 support area, be aware of a bullish resumption for wave 5 of a higher degree wave C/3.

Become a premium member
Get daily Elliott Wave updates for US Single Stocks, SP500,DAX, GOLD, SILVER, CRUDE, FX, CRYPTO, etc. or apply for unlimited access to the Elliot Wave educational videos.