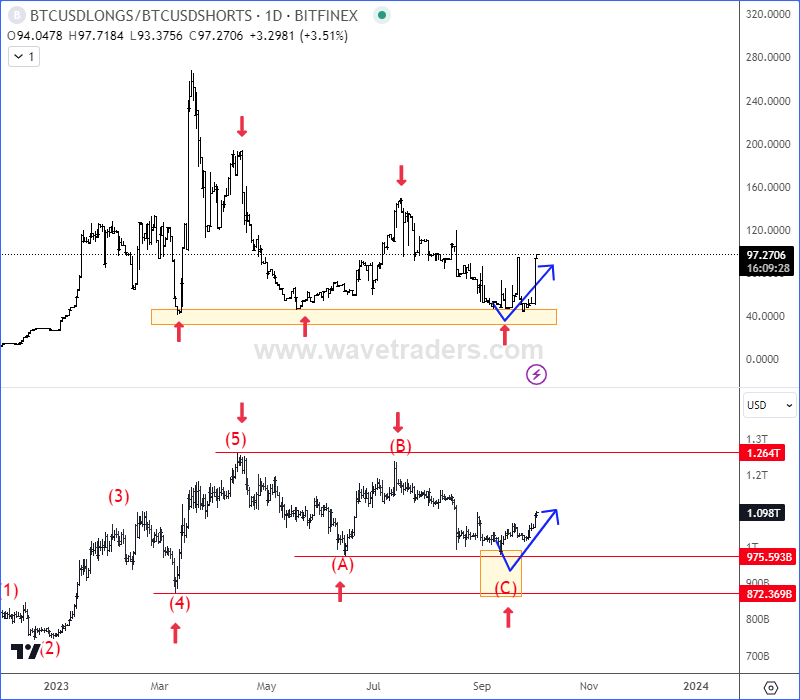
BTC Longs/Shorts Ratio Chart Is Waking Up from the support Along With The Crypto Market from technical point of view.
Back on September 07 we mentioned and highlighted strong support area on BTCUSD Longs/Shorts ratio chart, which is supportive for the Crypto market. CLICK HERE
The BTC Longs/Shorts ratio chart is a tool used by cryptocurrency traders to gauge market sentiment and potential price movements in the Bitcoin (BTC) market. This chart displays the ratio of long positions (those betting on the price of BTC to rise) to short positions (those betting on the price of BTC to fall) among traders. Analyzing this ratio can provide insights into how traders are positioned and can be used as a contrarian indicator.
When BTC longs are at the lows. If the number of long positions (bullish bets) in the market is at a low point, it may indicate that traders are not very optimistic about BTC’s price prospects. This could be due to recent price declines.
Market can react opposite as the crowd. When sentiment is excessively bearish (high shorts and low longs), it can signal a potential market reversal. Contrarian traders often take the opposite side of the majority sentiment. If the crowd is overly bearish, there may be a chance that the market could react by moving in the opposite direction, potentially leading to a price recovery which can be happening on bitcoin just now.

We talked about Bitcoin’s correction and support last week. Check our blog HERE.
Become a premium member
Get daily Elliott Wave updates for some major Digital currencies, FIAT currency markets, major stock indexes, gold, silver, crude etc. or apply for unlimited access to the Elliot Wave educational videos.
Crude Oil May Stay In Recovery Mode. Check our blog HERE.