Bitcoin Cash Is Coming Lower Out Of A Triangle, which indicates for the final leg before a reversal from technical and Elliott wave perspective.
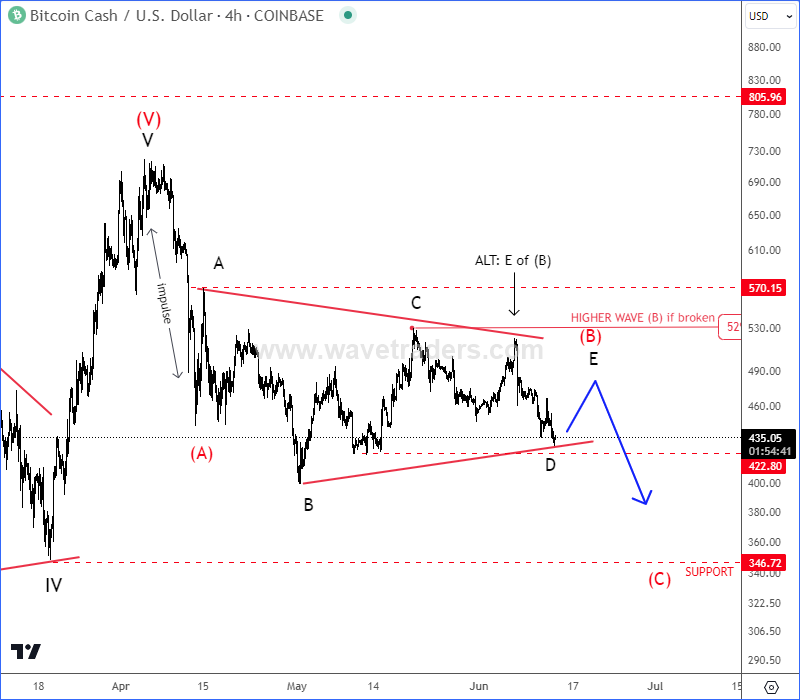
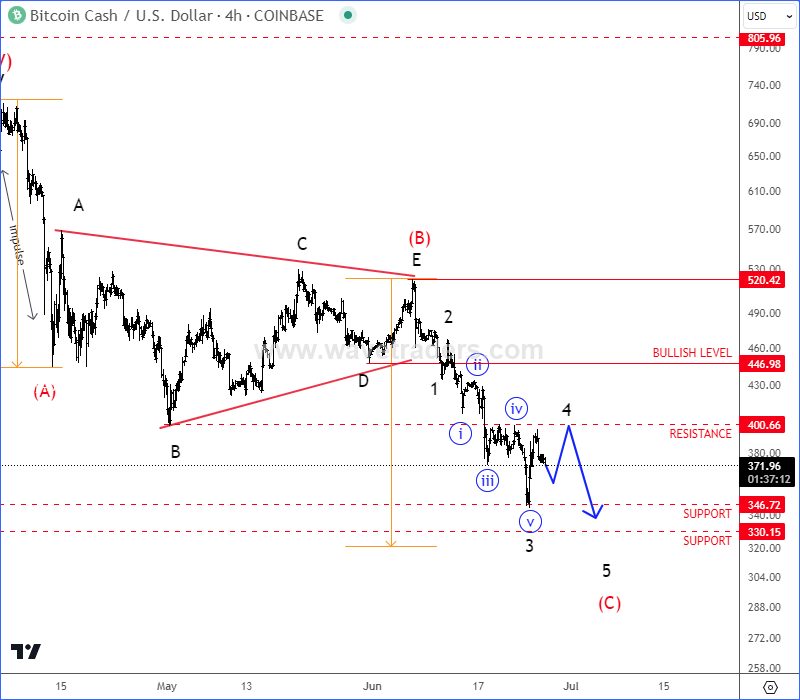
Bitcoin Cash with ticker BCHUSD completed five-wave bullish cycle on a daily chart, which is now followed by higher degree A-B-C corrective setback we been highlighting weeks back. After a sharp drop into wave A, we have been warning about sideways bearish triangle pattern in wave B before wave C showed up in the 4-hour chart.

If we take a look at the updated 4-hour chart, we can see price coming lower either out of wave (B) triangle pattern, which means that sooner or later this weakness can come to an end, since we know that the triangle occurs prior to the final move within a higher degree structure. As such, the coin can be trading in late stages of wave (C) which represents final leg of a correction from 700 so be aware of a reversal, but after another push down, that can show up after the current subwave 4 rally. Some resistance is at 400, and support near 300.

Become a premium member
Get daily Elliott Wave updates for US Single Stocks, SP500,DAX, GOLD, SILVER, CRUDE, FX, CRYPTO, etc. or apply for unlimited access to the Elliot Wave educational videos.
NIKKEI225 Forms A Bullish Triangle?. Check our free chart HERE.