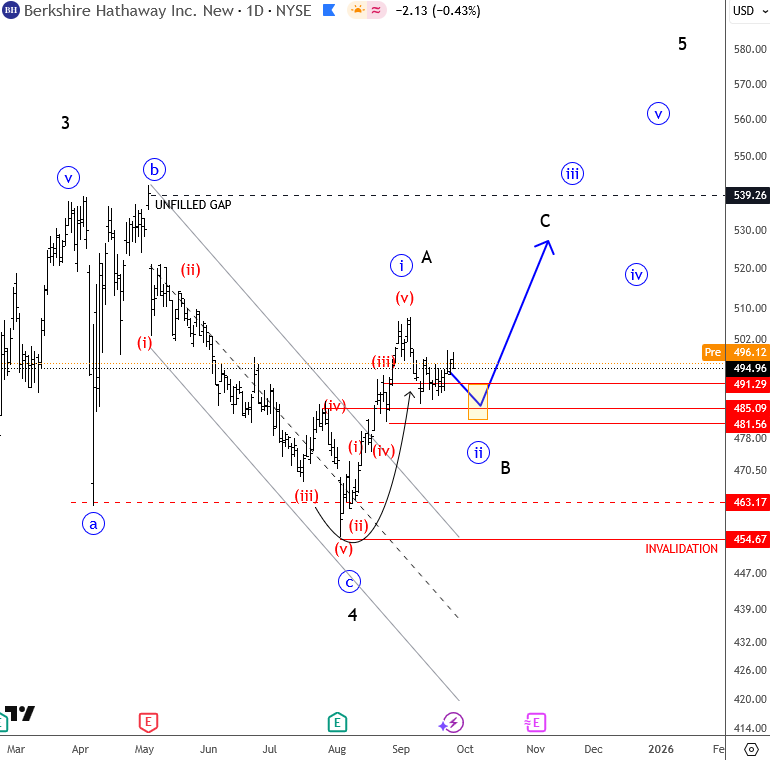
When I scan through charts, whether it’s stocks, currencies, or commodities, I want to focus on something that has a clear wave structure. Patterns like this allow me to read price action with more confidence, without needing to guess or force an opinion. Berkshire Hathaway is one of those charts right now.
What stands out is the sharp selloff, which looks like a textbook impulse. More importantly, there’s also a clear impulsive move from the lows. That combination suggests we could be looking at wave C low of a completed flat correction. If that’s the case, then more upside should follow.
Even in a less bullish scenario, where the structure plays out only as a temporary A-B-C rally, we would still expect further gains in wave C after the current pause. Either way, the clear structure points higher near term.
For me, this is where the opportunity lies. Markets are full of noise, but when you find a chart with this kind of clarity, it becomes easier to focus and build a plan around it.
Grega
Trading Takeaways
- Bias: Upside while above recent lows
- Potential: Wave C continuation higher
- Invalidation: Break below current lows would question bullish view
US Single Stocks Service
Get Elliott Wave US Single Stock updates for some big names and companies