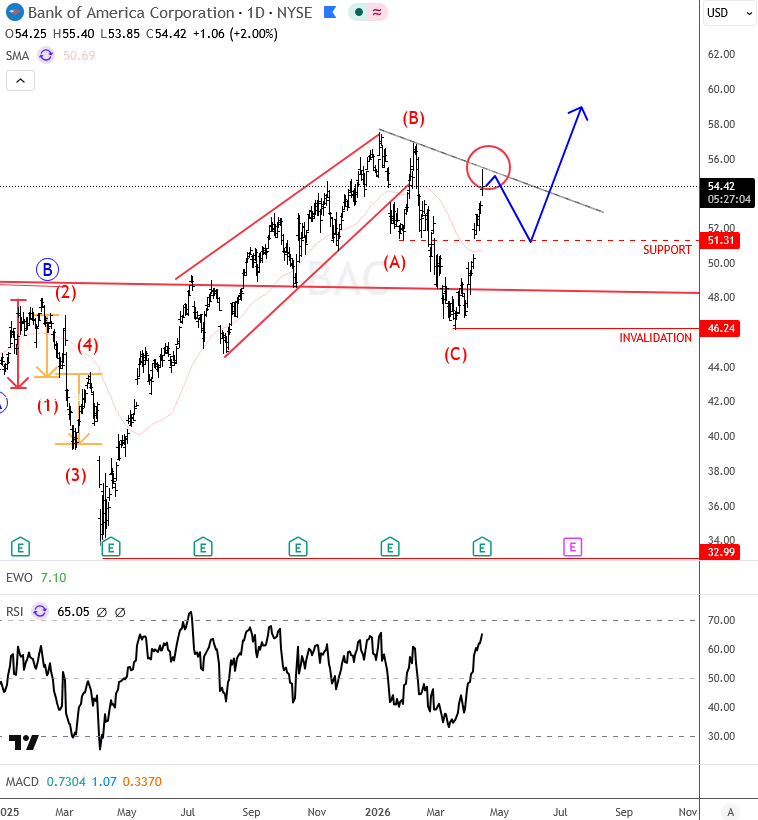
Bank of America has completed a three-wave ABC corrective decline on the daily chart, which suggests that bullish momentum is still intact. This supports the possibility of a bullish continuation, especially if price breaks above the trendline near the 56 level. In the meantime, we should watch for short-term pullbacks, with support in the 51–50 area. The bullish bias remains valid as long as price holds above the 46 invalidation level.
On the higher timeframe (monthly charts), there is still room for further upside following the breakout from a larger bullish triangle pattern. The price potential extends toward the 60–70 area, with a possible longer-term extension toward the 90 level based on the full triangle projection.
Highlights:
・ABC decline indicates a correction within the bullish trend
・Break above the trendline confirms a bullish resumption
・Support on dips is at 51-50, while the invalidation level is at 46
Become a premium member
Get daily Elliott Wave updates for US Single Stocks, SP500,DAX, GOLD, SILVER, CRUDE, FX, CRYPTO, etc. or apply for unlimited access to the Elliot Wave educational videos.