Today, we look back and how eBay played out, why and how is it sharply selling off from our projected resistance zone. Back on January 6th – we warned our members of potential resistance on eBay stock, and our expectation was strong sell off in wave C after wave B completed its retracement to fill the GAP (more on gaps at the end of the article) – which has been respected by the market.
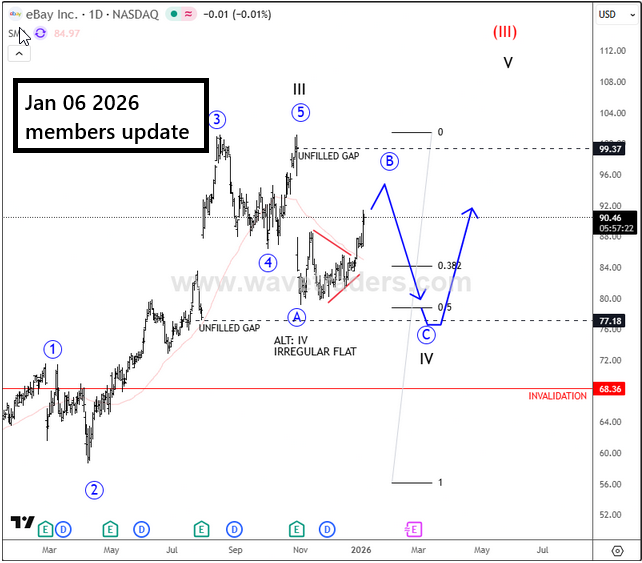
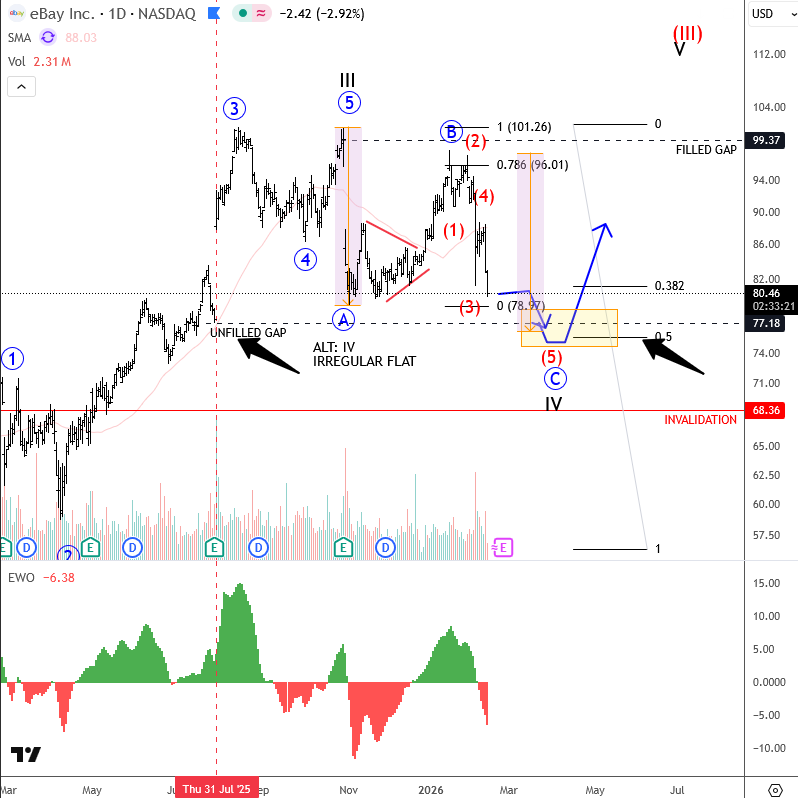
Recently, we have seen strong sell off since the gap has been filled. This is our latest Ebay stock update which has been sent out 5 days ago – and this is what we said to our members:
“eBay is seeing a sharp decline after the gap was filled near 98 as discussed in our previous updates. So this reversal is not a surprise, and the selloff looks impulsive which could be wave C moving lower into an attractive support zone around 77.
That area is interesting, as wave C would be equal to wave A there, and it also aligns with the July 2025 earnings gap near 76–77. If someone is looking for potential long opportunities, this is certainly a zone to watch for signs of stabilisation and a possible rebound”
Why gaps matter:
Price gaps in the market matter because they highlight sudden supply-demand imbalances that form during trading halts—such as weekends, holidays, or session breaks—driven by overnight news, data releases, like earnings or events. These discontinuities reveal shifts in sentiment and momentum, often marking the start of a trend (breakaway gaps), continuation (runaway gaps), or exhaustion (common/exhaustion gaps), while also serving as future support or resistance levels that traders target. Firstly they act as a magnet till they are filled, then price again changes a dirrection when new unfilled, skipped orders in that area are finally activated/filled.
Become a premium member
Get daily Elliott Wave updates for US Single Stocks, SP500,DAX, GOLD, SILVER, CRUDE, FX, CRYPTO, etc. or apply for unlimited access to the Elliot Wave educational videos.