If you’ve been following our free analysis or monthly webinars, then you know we’ve been bearish on the US dollar for quite some time. And based on current price action, that bearish trend may not be over just yet.
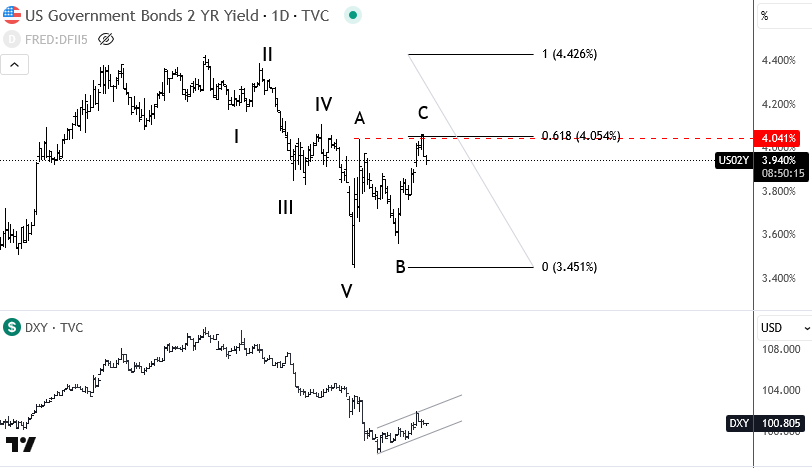
The recent rebound from the April lows looks like just a temporary consolidation before further weakness resumes. One key reason for this view lies in the US bond market—specifically the 2-year yield, which is showing a very clean Elliott Wave pattern. We’ve seen five waves down, followed by an A-B-C corrective rally that already retested the important 61.8% Fibonacci resistance.
This suggests a possible turn to the downside is near, especially after this week’s softer-than-expected US CPI data, which came in at 2.3% versus 2.4% expected. If inflation continues on this path, the Fed may be more inclined to cut interest rates sooner rather than later.
The completed A-B-C rally on the 2-year yield chart suggests more downside ahead in yields—and when that kicks in, it will most likely send the US dollar out of its current bear flag pattern.
–Grega
Become a premium member
Get daily Elliott Wave updates for US Single Stocks, SP500,DAX, GOLD, SILVER, CRUDE, FX, CRYPTO, etc. or apply for unlimited access to the Elliot Wave educational videos.