What is Elliott Wave Theory?
The Elliott Wave Theory is a detailed explanation of how groups of people act. It shows that the overall mood shifts from negative to positive and back naturally, making specific and measurable patterns.
One of the simplest places to witness the Elliott Wave Principle in action is in the financial markets. Here, changes in how investors feel are seen in how prices go up and down. If you can spot patterns that repeat in prices and figure out where the price is in those patterns today, then you can guess where the price will likely go next, using certain Elliott wave rules.
Using the Elliott Wave theory is like dealing with chances. An Elliottician is someone who can see how the market is organized and predict the most likely next step based on where we are in those structures: either a correcting pattern or a big move pattern. By knowing these Elliott wave patterns, you’ll know what the markets are expected to do next and, importantly, what they probably won’t do. By using the Elliott Wave theory, you can identify the moves that are most likely to happen with the smallest amount of risk.
The practical application of the Elliott Wave Theory is akin to deciphering the ebbs and flows of a tide. As this theory delves into the collective psyche, it becomes a tool for understanding how human behavior, as a group, influences the financial landscape. By recognizing the predictable patterns that emerge from shifts between pessimism and optimism, investors gain the advantage of a compass guiding them through the unpredictable world of markets.
In essence, the Elliott Wave Principle acts as a roadmap of market sentiment. Just as a seasoned traveler can anticipate twists and turns on a familiar route, an adept analyst who understands the intricacies of this principle can navigate the twists and turns of market trends. This technique not only sheds light on potential opportunities but also aids in managing risks more effectively. By embracing the Elliott Wave theory, market participants equip themselves with a clearer perspective on where the currents of mass psychology might lead next, and how to position themselves to ride those currents to their advantage.

Elliott Wave School
Video lessons about the Elliott Wave theory. Access to more than 7 hours of educational material
GIFT: one month free access to our premium services)
“Our educational videos are recommended to students who already understand the basics of technical and Elliott Wave analysis but want to take it to the next level“
Learn The Elliott Wave Theory
Our Elliott Wave Theory course, spanning nearly 7 hours in length, contains extensive information and in-depth video material on Elliott wave theory rules, Elliott wave impulse, Elliott wave corrections and even Elliott wave trading.
About 12 years of resources and knowledge are packed into these courses – giving you the best possible chance of delving deep into the topic and learning as much as the experts.
We know that the Elliott wave theory may not be easy to understand, which is the reason why we prepared this program. You will understand the Elliott wave rules, patterns such as Elliott Wave Corrective Patterns, ABC Correction, Ending Diagonal, Expanded Flat and others as simply as possible with illustrations and practical examples.
Besides our videos, we also recommend the book entitled Elliott Wave Principle: Key to Market Behavior written by Robert R Prechter.
WHAT YOU WILL LEARN WITH ELLIOTT WAVE COURSE
1. EWS Part 1: What Is Elliott Wave Theory?
In this video, we talk about the Elliott wave theory in general. The Elliott Wave principle was discovered by Ralph Nelson Elliott who was an American accountant and author. His study of stock market data led him to develop the Elliott wave analysis, which is a description of the cyclical or even pessimist nature of trader psychology and a form of technical analysis. It identifies trends and reversals in the financial markets.
2. EWS Part 2: Wave Theory At Work?
In the second video, we take a look at some real examples of Elliott wave theory and predictions, which we analyzed over the last few years. This will show you how the Elliott wave theory works, and most importantly – why it works. We will look at some different Elliott wave patterns, before and after Elliott wave charts on various markets.
3. EWS Part 3: Motive Wave – “Impulse”
We will go through the Elliott Wave rules and guidelines of an impulse, how to identify an impulse Elliott Wave pattern, what to look for and what it really matters. We will show you the Elliott Wave channeling technique and how to apply the Fibonacci indicator on Elliott Wave impulse waves – this includes when wave 2 can end, what to look for in wave 3, wave 4 and where & how to project the end of wave 5).
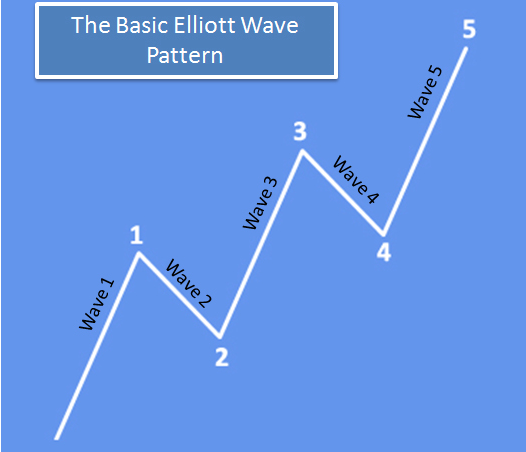
The Elliott Impulse Wave is structured by 5 sub-waves in the direction of a stronger trend. The picture below shows a five wave move to the upside, meaning that the price is experiencing an uptrend.
4. EWS Part 4: Motive Wave – “Elliott Wave Diagonal Triangles“
We go through rules and guidelines of Elliott wave diagonal triangles, how to identify the diagonal triangle, and what are the personality of those patterns. Here we show you how to take advantage of these structures and prices, how & when to take action and what to expect when the Elliott wave diagonal is completed, and more importantly when it is completed. We will look at some samples on real charts.
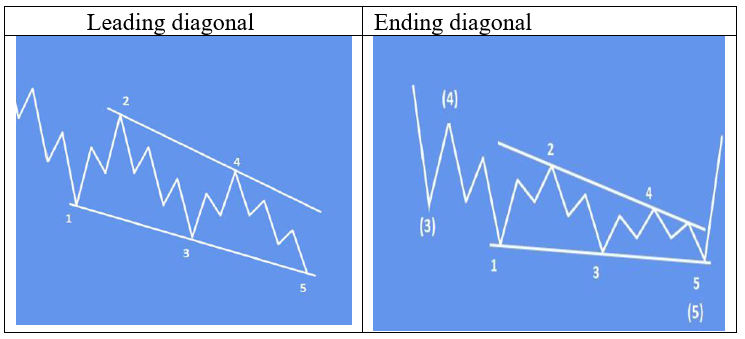
Elliott Wave diagonal is a common 5-wave motive pattern labeled 1-2-3-4-5 that moves with the larger trend. Diagonals move within two contracting channel lines drawn from waves 1 to 3, and from waves 2 to 4. There are two types of diagonals: leading diagonals and ending diagonals. They have a different internal structure and are seen in different positions within the larger degree pattern. Ending diagonals are much more common than leading diagonals.
5. Elliott Wave School Part 5: Corrections
We walk you through the rules and guidelines of different types of Elliott Wave corrections, how to identify them, what is the personality of each Elliott Wave corrective abc pattern, what to look for when trying to call an end of the Elliott Wave corrective pattern, and when to take action.
Here we describe everything with Elliott Wave channeling techniques as well as the Fibonacci indicator for each corrective pattern. We will also cover confirmation levels, what this is and why it matters. We take a look at some of the trading examples, those that worked out well and some that didn’t, and the reasons why.
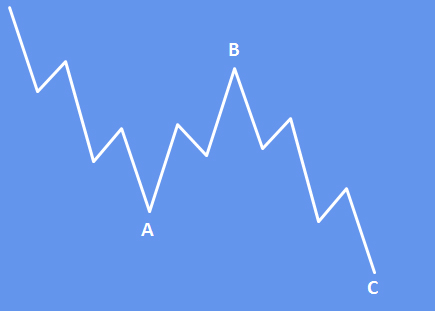
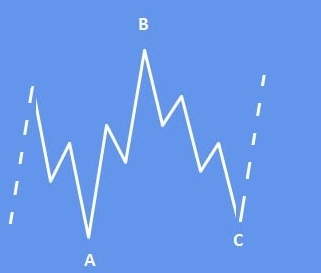
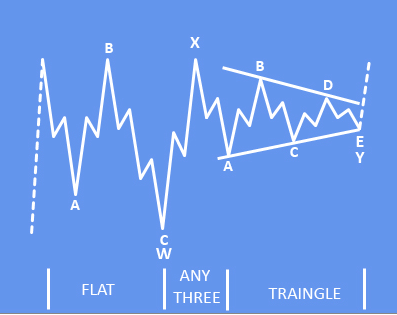
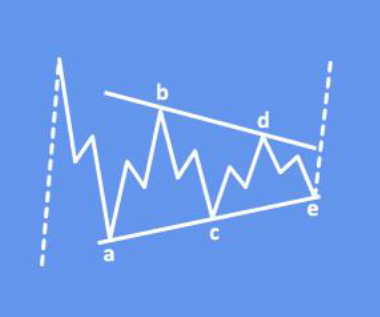
Elliott wave corrective patterns are labeled with letters, and move against the larger trend. We know the following Elliott wave patterns:
6. Elliott Wave School Part 6: 10. Trading Tips
We will give you a list of 10 Elliott Wave trading tips that we found useful when analyzing, tracking and trading markets in combination with the Elliott Wave analysis.
7. Additional Video 1. (webinar recording)
Step by step process presented on Elliott wave trading examples and how to define your risk-comfort level.
8. Additional Video 2. (webinar recording)
Quick Review of rules for a correction and impulse, and trading examples.
9. Additional Video 3. (old technical video analysis)
This is one of our videos in which I cover technical analysis for DAX with different market tools in combination with the EW theory.