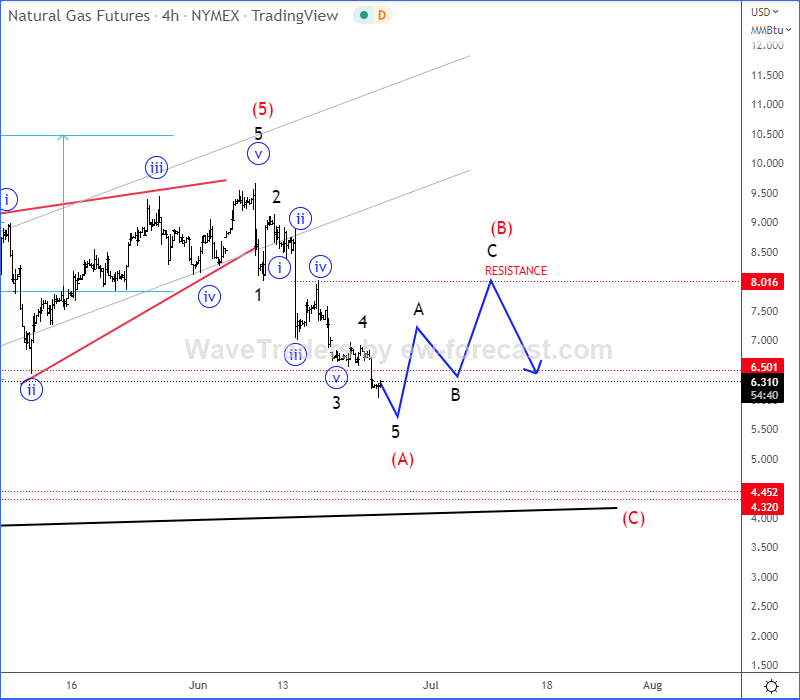
Hello traders, today we want to share Natural gas chart. We actually see sharp and impulsive decline from the highs after finishing the projected 5th wave around 10.0 level.
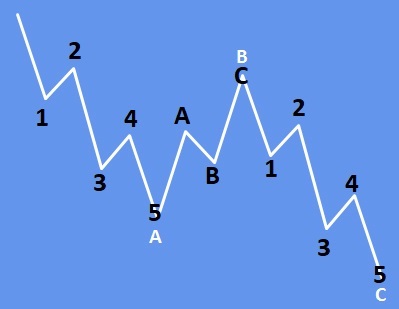
From Elliott wave perspective, an impulsive five-wave drop from the highs suggests temporary top and new, higher degree three-wave (A)-(B)-(C) corrective pullback called a zig-zag correction. Currently we can see it finishing wave (A), so after a corrective recovery in wave (B) be aware of further weakness within wave (C).

From a technical point of view, we will ideally see bounce and recovery here around 6.0 level and back to 8.0 resistance area, from where we can expect another sell-off down to projected strong 4.0 support zone.
All the best!

Some basic rules for zig-zag correction:
-A zigzag correction always subdivides into three waves.
-Wave A always subdivides into an impulse or leading diagonal.
-C wave always subdivides into an impulse or ending diagonal.
-Wave B always subdivides into a zigzag, flat, triangle or combination.
-Wave B never moves beyond the start of wave A.
Cryptocurrencies look attractive again. You may want to check our latest SNXUSD chart. CLICK HERE