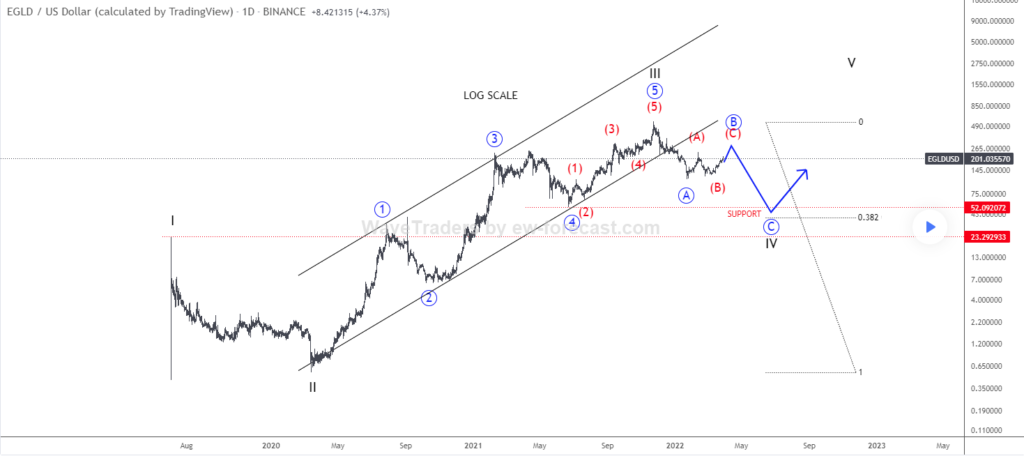
Looking at the weekly logarithmic scale chart, we can clearly see a completed five-wave cycle within higher degree wave III and with broken channel support line. EGLD could be now trading in wave IV correction.
Corrections are made by three waves A-B-C and ideally back to the former wave 4 swing low. So current recovery looks to be just a three-wave corrective rally in wave B. Before we will see another decline for wave C.
What we want to say is that in the short-term. EGLD can see more gains towards 250 -350. Maybe even 400 area for that wave (C) of B. But later then watch out for another decline towards strong 50 support level before real bulls for a higher degree wave V show up.
