USDJPY has finally turned sharply to the downside, with the recent sell-off likely being triggered by rising expectations of BoJ intervention. We warned about that back on June 24. After reaching the 164 area, the pair experienced a very strong decline in a short period of time, suggesting that an important top may already be in place. CHECK IT HERE
On the 4-hour chart, the bearish shift was confirmed after price broke below the trendline support extending from the previous triangle formation, followed by a break below the important 162.65 support level. These breaks indicate that the previous bullish structure has likely been completed and that a larger corrective phase may now be developing.
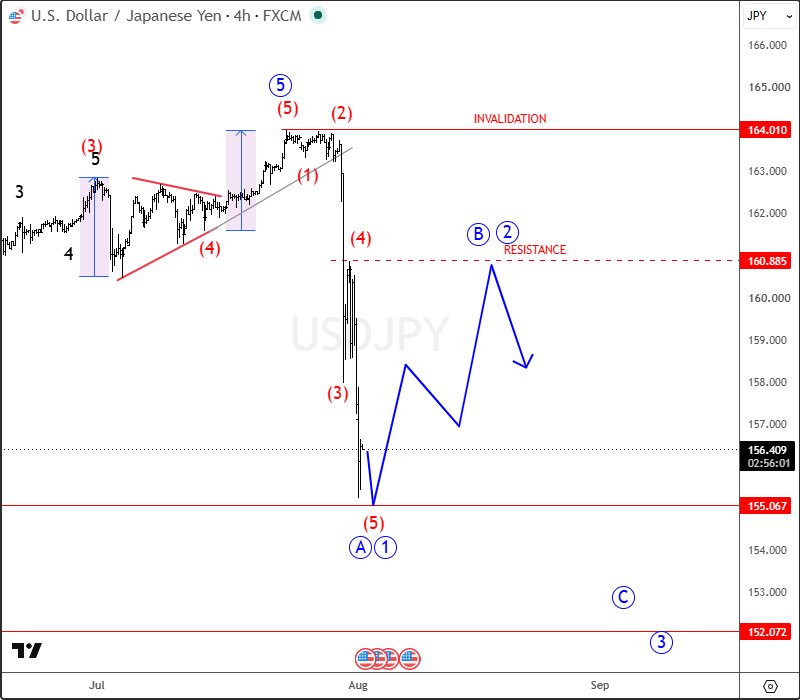
From an Elliott Wave perspective, USDJPY appears to be finishing wave (5) of an impulse into wave A/1. This means that the next move higher, if it develops, may only be a corrective recovery in wave B or potentially wave two before another leg lower begins. Initial stabilization could come around the 155 area, while the next important support zone is near 152.
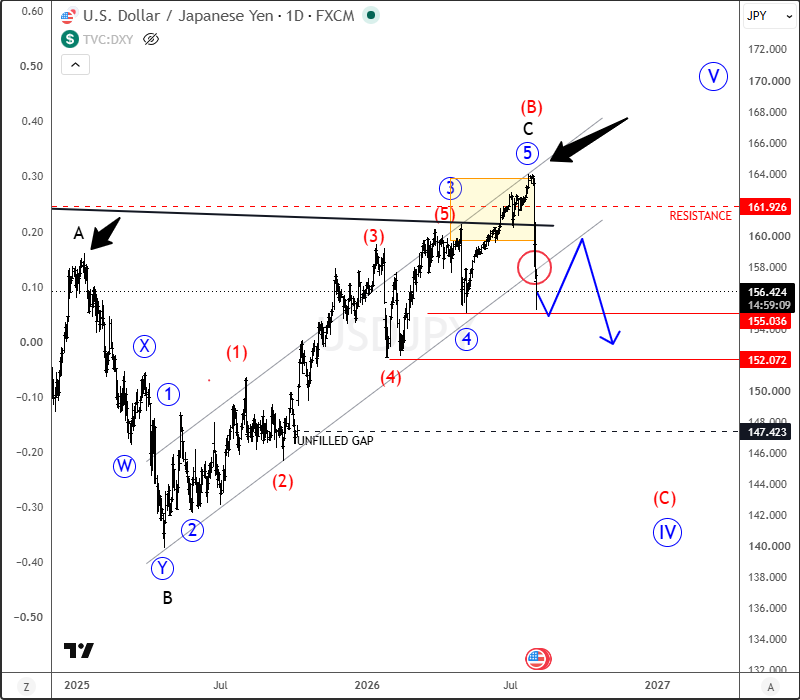
The daily chart also supports this view, as the previous five-wave advance from the lows appears mature and potentially completed. Therefore, any upcoming rebound should be treated cautiously, as it may represent only a temporary correction within a broader bearish sequence rather than the start of a new bullish trend.
Become a premium member
Get daily Elliott Wave updates for US Single Stocks, SP500,DAX, GOLD, SILVER, CRUDE, FX, CRYPTO, etc. or apply for unlimited access to the Elliot Wave educational videos.