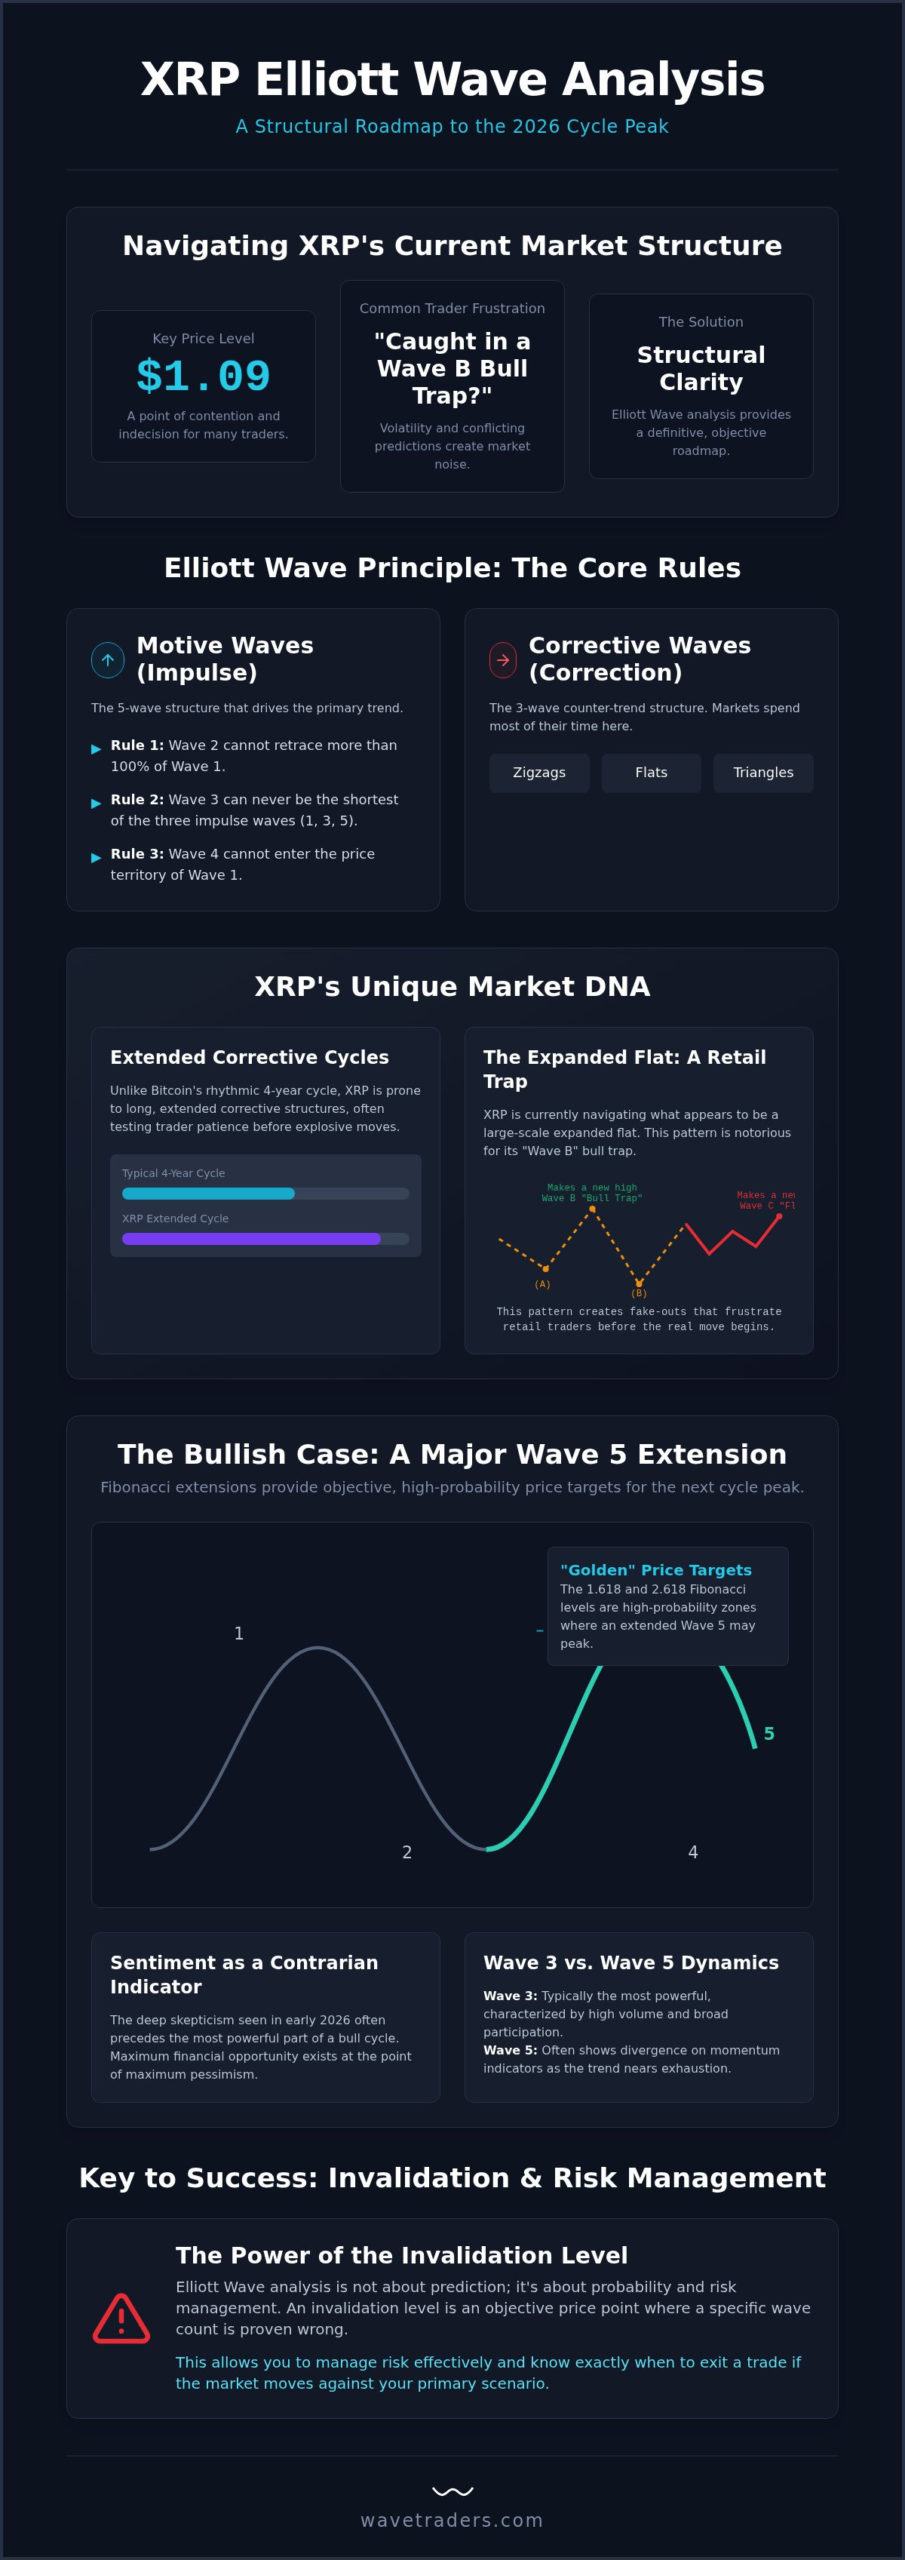
XRP’s stop-and-go price action isn’t random; it’s a textbook demonstration of extended corrective cycles that set the stage for explosive moves. While many traders feel trapped by the current $1.09 price level and the noise surrounding the CLARITY Act’s progress in the Senate, there is a clear logic to the movement if you know where to look. We understand the frustration of trying to filter through conflicting influencer predictions or the lingering fear that you’re caught in a “Wave B” bull trap. Volatility often makes traditional technical analysis feel insufficient, leaving you without a clear sense of direction.
This xrp price elliott wave analysis provides the structural clarity you need to move forward with confidence. We’ll map out high-probability wave counts and specific Fibonacci-based price targets for the 2026 market cycle. By the end of this guide, you’ll have a definitive roadmap of impulse and corrective waves, including defined invalidation levels to help you manage risk while tracking the path to the next cycle peak.
XRP’s price history is a fascinating study in market psychology. To conduct a proper xrp price elliott wave analysis, we first need to distinguish between the Grand Supercycle and the Intermediate waves. The Grand Supercycle represents the multi-decade growth of the asset, while Intermediate waves describe the multi-month swings we see on the daily charts. Currently, XRP appears to be finishing a long-duration corrective cycle that began following the 2018 all-time high. Unlike Bitcoin, which often follows a more rhythmic four-year cycle, XRP is prone to “extended” structures. These extensions happen when a single wave, usually Wave 3 or Wave 5, stretches significantly beyond the length of the other motive waves.
The regulatory period between 2020 and 2025 played a massive role in shaping this structure. The legal uncertainty caused by the SEC lawsuit acted as a fundamental anchor, preventing the asset from entering a true motive phase while other tokens rallied. This resulted in a complex, sideways Wave 4 that has tested the patience of many traders for years. We’re now watching for the transition from this corrective Wave 4 into a motive Wave 5, which would signal the start of the next major bull run as regulatory clarity finally takes hold.
A true motive phase is defined by a five-wave impulse structure. According to the Elliott Wave principle, there are three unbreakable rules: Wave 2 cannot retrace more than 100% of Wave 1, Wave 3 can never be the shortest of the three motive waves, and Wave 4 cannot enter the price territory of Wave 1. In XRP’s historical runs, Wave 3 is rarely the shortest; in fact, it often becomes the most vertical and explosive part of the move. When XRP enters an impulsive phase, the price action typically becomes very direct, with few deep pullbacks until the internal five-wave structure completes.
Markets spend most of their time in corrections, which take the form of zigzags, flats, or triangles. XRP is currently navigating what looks like a large-scale sideways range, likely an expanded flat. These patterns are frustrating because they often involve “fake out” moves that trap retail traders by creating temporary new highs or lows. The time element is a powerful predictor here. By measuring the duration of previous corrective cycles, we can estimate when the current sideways range is likely to exhaust itself. In terms of structure, if Wave 2 was a sharp and deep zigzag, then the Rule of Alternation suggests that Wave 4 will be a complex, time-consuming sideways pattern such as a flat or a triangle.
Analyzing the bullish potential of XRP requires a disciplined approach to Fibonacci extensions. While many traders look at round numbers, we look at the mathematical relationships between previous waves. In a standard xrp price elliott wave analysis, the 1.618 and 2.618 extensions are regarded as “Golden” targets. These levels aren’t arbitrary; they represent the mathematical expansion of the initial motive phase. If XRP is indeed embarking on a major Wave 5 extension, these targets provide the most likely areas for the cycle to peak. We’ve seen this asset stretch significantly beyond expectations before, and the current structure suggests we’re nearing a similar inflection point.
The current setup bears a striking resemblance to the impulsive runs seen in 2017 and 2021. During those periods, price action moved from a state of extreme apathy to vertical acceleration. Sentiment analysis is a key component of our methodology. Elliott Wave theory suggests that when the broader market reaches a state of “extreme” euphoria, the wave is often nearing completion. Conversely, the deep skepticism we’ve seen throughout early 2026 often precedes the most powerful part of the cycle. Understanding these cryptocurrency market cycles helps traders remain objective when the rest of the market is driven by emotion. Traders who want to see how these same cycle dynamics apply to other high-velocity assets can explore our Solana Elliott Wave analysis mapping the path to the 2026 cycle peak for a comparative perspective.
One of the most critical questions we face is whether the current move is a Wave 3 of 3 or a terminal Wave 5. Wave 3 of 3 moves are typically the most powerful. They’re characterized by high volume and broad market participation. If we see a sustained increase in volume as the price breaks above the $1.09 level, it likely confirms we’re in the heart of a motive phase. A terminal Wave 5 often shows divergence on momentum indicators. Identifying the “sub-wave 1” of the next higher degree is essential for determining which scenario is playing out in real time.
Reliable forecasting doesn’t rely on a single price level. Instead, we look for confluence zones where multiple Fibonacci measurements overlap. Our log-scale analysis suggests primary targets in the $4.00 to $8.00 range, with the potential for double-digit extensions if Wave 5 mimics the 2017 run. These clusters act as a magnet for price action, providing a clearer roadmap than any single-level prediction. If you’re looking to refine your own projections, using a tool like the Elliott Wave Calculator can help you identify these specific confluence zones for your xrp price elliott wave analysis. Clusters are far more reliable than single-level targets because they represent a consensus of mathematical probabilities across different timeframes.
XRP is famous for sideways ranges that seem to defy logic. These periods often take the form of an “Expanded Flat,” which is perhaps the most frustrating pattern for retail traders to navigate. In this structure, Wave B actually travels beyond the start of Wave A, creating a fake breakout that lures in buyers before a final Wave C flush wipes them out. This is a common occurrence in any xrp price elliott wave analysis because it preys on the emotional desire to catch a move before it happens. Understanding that a new high within a correction can still be part of a larger downward move is essential for preserving capital. The same expanded flat traps appear across the broader altcoin market, as detailed in our solana Elliott Wave analysis, where notorious “wicky” price action creates nearly identical corrective structures.
Momentum indicators like the RSI and MACD are invaluable during these phases. We look for momentum divergence at the end of a correction. If the price makes a lower low in Wave C but the RSI shows a higher low, it suggests the selling pressure is exhausting. The time factor also plays a massive role. XRP’s motive waves are typically fast and vertical, often completing in a matter of weeks. In contrast, its corrective waves can last for months or even years. Recognizing this disparity helps you adjust your expectations and avoid overtrading during the boring middle of a cycle.
Corrective waves are designed to test your conviction. Wave 2 often feels like a return to a permanent bear market because it retraces so much of the initial Wave 1 gain. This is where most traders give up. Another common structure is the “Triangle” consolidation, which often appears in the Wave 4 position. These patterns represent a balance between buyers and sellers, with the price squeezing toward an apex. Managing your emotions during these phases is a skill in itself; the goal is to remain an observer until the market provides a clear breakout signal.
We look for specific technical markers to confirm a correction is over. One of the most reliable is the 1:1 ratio, where Wave C is equal in length to Wave A. While corrections are generally three-wave moves (A-B-C), the internal structure of Wave C is actually a five-wave motive sequence. If you can count five clear sub-waves within that final leg down, the probability of a reversal increases significantly. For those looking to master these nuances, the Wavetraders Elliott Wave School offers structured training to help you identify these patterns with precision. Mastering the end of a “C” wave allows you to enter the next motive phase with a defined risk-to-reward setup.
Objective trading requires a clear line in the sand. In any xrp price elliott wave analysis, an invalidation level is the price point where a specific wave count is mathematically proven incorrect. Without these levels, analysis becomes mere guesswork. For a bullish motive wave to remain valid, the most critical rule is that Wave 4 cannot enter the price territory of Wave 1. If XRP’s price retraces deep enough to overlap with that initial peak, the impulsive count is dead, and we must pivot to an alternate scenario immediately.
Setting stop-losses based on this structure is far more effective than using arbitrary percentages. If the invalidation level for a Wave 3 entry is the start of Wave 1, that is where your stop belongs. This approach ensures you’re only in the market when your thesis is intact. Given XRP’s current price of approximately $1.09 and its inherent volatility, position sizing becomes your most powerful tool. You shouldn’t risk more than a small percentage of your total equity on a single setup, regardless of how perfect the wave count looks on the chart.
We always maintain a bearish alternate count to stay grounded. What if the current move isn’t the start of a new bull run, but rather a large B-wave in an expanded flat correction? This bearish alternate suggests a final flush to lower levels before the true bottom is in. Conservative traders often wait for a break of the Wave 1 high to confirm the trend. Aggressive traders might enter at the 61.8% retracement of the first sub-wave. Having both plans ready allows you to react without emotion when the market hits your invalidation level.
The disciplined rules of the Funded Trader Program align perfectly with the Elliott Wave methodology. Prop trading requires strict adherence to daily loss limits and maximum drawdowns, which forces you to use the structural invalidation levels we’ve discussed. By leveraging these programs, you can trade XRP’s volatile cycles with reduced personal capital risk while following a professional framework. If you’re ready to apply these risk management rules to your own trading, you can explore our funded opportunities to see how professional capital can support your xrp price elliott wave analysis.
Static blog posts provide a helpful foundation, but the speed of the 2026 crypto market often demands a more dynamic approach. A single xrp price elliott wave analysis can shift in an afternoon if a key level breaks or a sub-wave extends unexpectedly. This is why real-time analysis is essential for anyone serious about navigating these cycles. Our Digital Currency Service was built to provide this constant context, offering live charts and video updates that break down complex structures into clear, actionable insights. We don’t just provide a count; we explain the reasoning behind it so you can learn to see the patterns as they form.
The Wavetraders advantage comes from over 20 years of experience. We’ve been providing active market education and technical analysis since 2003, applying the same disciplined principles to the digital frontier that we use for traditional assets. While many market participants are distracted by social media noise or regulatory headlines, we maintain a composed focus on price action and market structure. Joining our community allows you to move beyond the pressure of the “trading alert” mindset and adopt the steady, methodical approach of a professional practitioner. We invite you to track the markets together with us, using objective data to guide every decision.
Learning to perform your own xrp price elliott wave analysis is a transformative skill for any trader. Our Elliott Wave School offers a structured curriculum designed to take you from the basic rules of impulse waves to the nuances of complex corrective patterns. We rely heavily on video lessons because visualizing market structures is far more effective than reading about them in a textbook. By mastering these counts, you build a lifelong skill that isn’t limited to XRP. The same principles of human psychology and pattern recognition apply to FX, stocks, and commodities, giving you a universal framework for any liquid market.
Objective analysis is the only sustainable way to survive the extreme volatility of the crypto space. If you find yourself reacting to every price swing with anxiety, it’s usually because you lack a clear roadmap. By focusing on high-probability wave counts and strictly defined invalidation levels, you remove the guesswork from your strategy. We provide the tools, the education, and the real-time updates you need to stay ahead of the next cycle peak. Join Wavetraders and access our real-time Digital Currency Service today.
Identifying the primary wave structure is only the first step in successful trading. The real advantage lies in distinguishing between a potential Wave 5 extension and the frustrating traps of an expanded flat correction. By applying a disciplined xrp price elliott wave analysis, you can move away from the noise of social media influencers and rely on the objective mathematics of Fibonacci clusters and structural invalidation levels. This methodical approach ensures you’re prepared for vertical moves while protecting your capital during the inevitable sideways ranges.
If you’re ready to move beyond static charts, we invite you to join our community. Since 2003, we’ve helped traders master market cycles through our comprehensive Elliott Wave School and expert real-time analysis. Whether you’re looking for structured education or access to our Funded Trader Program, we provide the framework needed to trade with quiet confidence. Apply for the Wavetraders Digital Currency Service and Master XRP Cycles to begin tracking these waves with us. Let’s navigate the complexities of the 2026 market together.
Elliott Wave theory is highly reliable for volatile assets because it measures the underlying investor psychology that drives price swings. In a market like XRP, these psychological shifts create distinct, repeating patterns that help analysts filter out emotional noise. This methodology allows us to identify the difference between a random price spike and a structural trend reversal.
The Expanded Flat is the most frequent corrective structure we observe in XRP. This pattern often traps retail traders because Wave B travels beyond the previous high, creating a false sense of a breakout. Understanding this structure is a key part of an xrp price elliott wave analysis, as it prepares you for the final Wave C flush that typically follows.
The primary signal of invalidation is a violation of the non-overlap rule. If the price action during a supposed Wave 4 retracement moves into the price territory of Wave 1, the impulsive count is mathematically proven incorrect. We also watch for Wave 2 retracing more than 100% of Wave 1 as a definitive sign to pivot to an alternate count.
We focus on the 1.618 and 2.618 Fibonacci extensions when projecting targets for impulsive motive waves. For corrective pullbacks, the 0.618 retracement level often provides the most reliable support zone. When multiple Fibonacci levels from different wave degrees cluster in the same price area, it creates a high-probability confluence zone for a trend change.
Elliott Wave theory is fractal, meaning the same patterns appear on all timeframes from monthly charts down to the 1-minute level. While cycle analysis often focuses on long-term peaks, you can use the same five-wave and three-wave rules for intraday setups. This flexibility makes it a powerful tool for both swing traders and active day traders in the crypto space.
For traders looking to automate these intraday patterns while maintaining full security over their API keys, they can discover unCoded and its self-hosted trading bot solutions.
Fundamental events like the SEC case act as catalysts that influence the “Time” and “Complexity” elements of a wave. In XRP’s case, the regulatory uncertainty likely extended the duration of the Wave 4 corrective sideways range. The news didn’t break the rules of the xrp price elliott wave analysis; it simply provided the fundamental reason for a more time-consuming consolidation pattern.
Impulse waves are five-wave sequences that move the price aggressively in the direction of the primary trend. Corrective waves are typically three-wave structures, such as zigzags or flats, that move against the trend to consolidate gains. In the crypto markets, impulse waves are characterized by high volume and verticality, while corrections are often slow and frustrating.
Yes, we provide real-time updates through our Digital Currency Service. This service includes live charts and video analysis that track shifts in market structure as they occur. Since crypto markets move 24/7, our real-time updates ensure that members always have a current roadmap and know exactly where the primary invalidation levels sit.
DISCLAIMER
Any reviews, news, analysis, prices or other information contained on our website is provided as general market commentary and delivered electronically through a distribution channel to larger number of clients, therefore does not constitute investment advice or investment research. We are not trading advisors. Most of our work is for educational purposes only, with information based on Elliott Wave theory in real time. Trading forex, futures, options, stocks, cryptocurrenices or any another trading market carries a high level of risk, and may not be suitable for all investors.
The possibility exists that you could lose some or all of your initial investment; therefore you should not invest money that you cannot afford to lose. Our website and the information that we provide should not be relied upon as a substitute for extensive independent research before making your investment decisions. In no event will we be liable for any loss or damage on your account in connection with, the use of our products. For any real cash investments you have to contact your financial advisor.
Any information or material contained on our website is owned by Val Global d.o.o.. Reproduction is prohibited without Val Global d.o.o. prior license in writing.
By continuing to use the site, you agree to the use of cookies. Learn more.
The cookie settings on this website are set to "allow cookies" to give you the best browsing experience possible. If you continue to use this website without changing your cookie settings or you click "Accept" below then you are consenting to this.