For traders staring at a price chart, a falling market can feel like an endless descent. The key question is always the same: where does it stop? Missing the bottom means missing the start of a new, potentially profitable trend. Buying too early leads to the frustration of watching your position go further into the red. This is where understanding the technical definition of a trough in a wave becomes more than an academic exercise—it becomes a critical trading skill. Master the technical definition of a trough and learn how to identify high-probability trade entries using Elliott Wave theory.
Many traders see a trough as just a “low point” on a chart. This view is incomplete. A true trough is not merely a dip; it represents the point of maximum pessimism, the exhausted end of a corrective cycle that signals a high-probability reversal is imminent. By learning to distinguish a significant trough from minor market noise, you can improve your entry timing and trade with greater confidence.
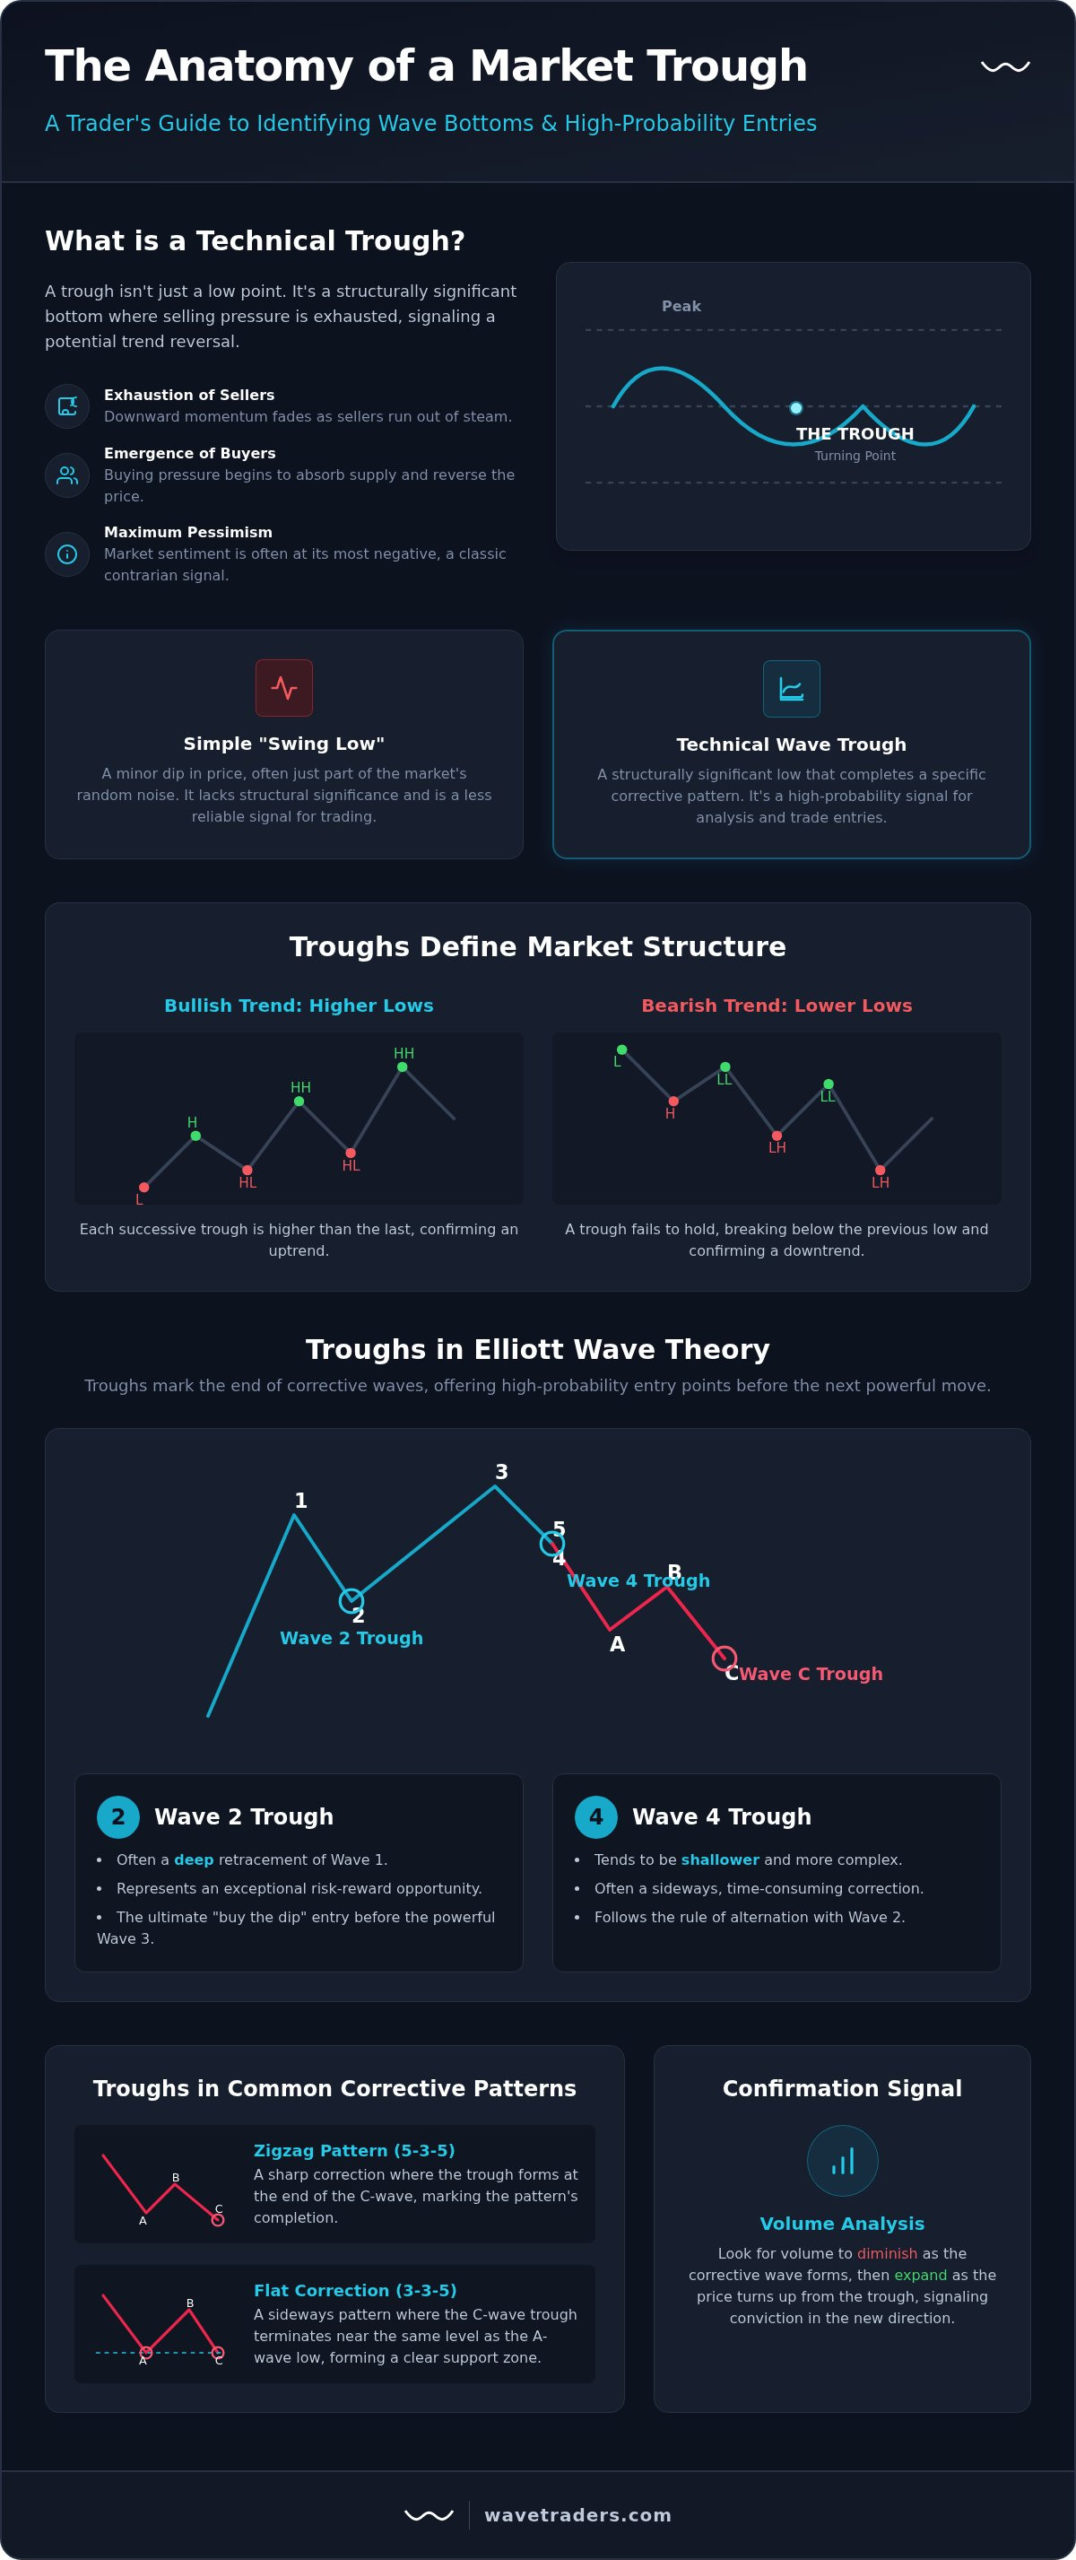
In technical analysis, a trough is the lowest point of a wave cycle before the price begins to rise again. It marks a temporary or long-term bottom where selling pressure is exhausted and buying pressure starts to take control. This shift in momentum from bearish to bullish is the defining characteristic of a trough in financial markets. At this point, market sentiment is often at its most negative, a psychological state that experienced traders recognise as a potential turning point.
This financial definition stands in contrast to a simple dictionary definition, which might describe a trough as a V-shaped receptacle, or even the low point in a macroeconomic business cycle. For a trader, a trough is a specific, actionable pattern on a chart that forms the building block of market structure—the sequence of peaks and troughs that defines the overall trend.
In physics, a wave has measurable properties like wavelength and amplitude, with the trough being its absolute lowest point. While visualising this helps, traders adapt the concept for market analysis. On a price chart, a trough isn’t just a single low price; it’s a zone that acts as a support level—an area where buying interest is strong enough to halt a decline.
It is also crucial to distinguish between a simple ‘swing low’ and a technical wave trough. A swing low can be any minor dip in price, part of the random noise of the market. A technical wave trough, particularly within Elliott Wave theory, is a structurally significant low that completes a specific corrective pattern. It has a predictable relationship to the waves that came before it, making it a far more reliable signal for analysis and trading.
The real power of identifying troughs lies in their role in defining market structure. A trend is not a straight line; it is a series of waves. In a healthy bullish trend, each successive trough will be higher than the one that preceded it. This pattern of ‘higher lows’ is one of the most fundamental confirmations of an uptrend.
From an analytical perspective, a major trough often establishes the ‘zero point’ for a new wave count, providing the foundation from which the next market move is measured. Conversely, in a strong bearish trend, you will often see ‘failed troughs’, where the price attempts to rally but quickly breaks below the previous low, confirming the continuation of the downtrend. Understanding where a trough *should* form—and what it means when it fails to do so—is a cornerstone of effective chart reading.
While general technical analysis provides a basic framework, Elliott Wave theory gives the trough a precise role and personality. The entire Elliott Wave principle is built on a repeating 5-3 pattern: five waves in the direction of the main trend (motive waves) followed by three waves against it (corrective waves). Troughs are the termination points of the downward corrective waves.
For traders, the most important troughs are those that form at the end of Wave 2 and Wave 4. These two waves are corrective pullbacks within a larger motive trend. Identifying the end of these corrections—the trough—allows a trader to enter a position just as the powerful motive waves (Wave 3 and Wave 5) are about to begin. Volume can be a key confirmation signal; we often look for volume to diminish as the corrective wave unfolds and then expand as price turns up from the trough, signalling conviction in the new direction.
A rare but important phenomenon is ‘truncation’, where the final motive wave (Wave 5) fails to move beyond the end of the third wave, and its trough fails to make a new low. Recognising this pattern can prevent traders from waiting for a lower price that never comes.
Wave 2 and Wave 4 troughs have distinct characteristics. A Wave 2 trough follows the initial impulse of Wave 1 and often retraces a significant portion of that first move. These deep pullbacks can be unnerving, as they erase much of the initial gain, but they also offer exceptional risk-reward opportunities. The Wave 2 trough is the ultimate ‘buy the dip’ opportunity before the typically long and powerful Wave 3 gets underway.
A Wave 4 trough, by contrast, tends to be shallower and more complex. According to the rule of ‘alternation’, if Wave 2 was a simple, sharp correction, Wave 4 will often be a complex, sideways correction (and vice versa). This means a Wave 4 trough may take longer to form and will typically retrace a smaller percentage of the preceding Wave 3. Understanding these differences is key to anticipating the character and depth of the next market bottom.
Elliott Wave theory further categorises the structure of these corrective moves, each with its own type of trough:
_
A trough cannot be fully understood without its counterpart: the peak (or crest). Together, they define the rhythm of the market. While a simple definition might call them the high and low points of a cycle, their relationship is what defines a trend. The foundational principle of trend analysis is the ‘Higher High, Higher Low’ (HH-HL) sequence for a bullish trend and the ‘Lower High, Lower Low’ (LH-LL) sequence for a bearish one. The trough is the ‘Higher Low’ or ‘Lower Low’ in these critical sequences.
The distance between a peak and the subsequent trough measures the severity of a correction, often referred to as the ‘Peak-to-Trough’ drawdown. This is a critical metric for risk management. The vertical distance between a trough and the next peak, known as the amplitude, indicates the strength and volatility of the market’s advance. Analysing these relationships moves a trader beyond simply identifying a low point to truly understanding the market’s behaviour.
In any market cycle, every trough is the starting point for the next crest. It is the launching pad for the subsequent rally. By measuring the amplitude of a market move from a confirmed trough, analysts can project potential price targets for the next peak. In some market conditions, a degree of symmetry can emerge, where troughs appear at predictable time intervals, though this is less reliable than price-based analysis. The key takeaway is that troughs are not isolated events; they are integral parts of a continuous cycle of expansion and contraction that drives all financial markets.
One of the most powerful signals in technical analysis is the ‘First Higher Low’. After a prolonged bear market, the first time the price makes a low that is clearly higher than the previous major trough, it serves as a strong indication that the downtrend is ending and a new bull market may be starting. This single event signals a fundamental shift in market structure.
The challenge is to differentiate between a minor corrective trough (like a Wave 4) and a major trend-reversal trough. This is where a comprehensive framework like Elliott Wave becomes indispensable. By understanding the expected depth and structure of different wave types, a trader can better assess the significance of a trough. For example, a deep retracement after five clear waves down is far more likely to be a major reversal point than a shallow dip in the middle of a chaotic, overlapping price structure.
Case Study: Analysing a Major Bitcoin Trough with Elliott Wave
Consider a major bear market in Bitcoin. An Elliott Wave analyst would first identify the five-wave impulse decline that constitutes the primary downtrend. The final trough, at the end of Wave 5, marks the point of ‘maximum pessimism’. Following this low, the first rally (Wave 1 of a new cycle) and its subsequent pullback (Wave 2) are scrutinised. When the trough of that Wave 2 forms at a level higher than the bear market’s absolute low, it creates the ‘First Higher Low’, providing the first objective evidence that the trend has shifted from bearish to bullish.
Identifying a trough in hindsight is easy. The skill lies in validating it in real-time to make informed trading decisions. A robust approach combines price action analysis with technical indicators to confirm that a low is not just a temporary pause but a genuine turning point. A critical part of this process involves setting a stop-loss just below the technical trough to manage risk effectively; if the price breaks below this validated low, the analysis is likely incorrect, and the position can be exited with a minimal loss.
The goal is to build a confluence of evidence. When multiple tools and techniques all point to the same conclusion, the probability of a successful trade increases dramatically. At Wavetraders, we use tools like our Elliott Wave Calculator to project potential lows, but we always wait for the market to confirm our analysis with clear price action and indicator signals.
Staying sharp and focused during these real-time evaluations is essential for success; if you’re looking for a way to keep your desk area cool and comfortable during long sessions, you might check out FrostWave.
Fibonacci retracement levels are an essential tool for anticipating where a corrective wave might end. They work by identifying potential support levels based on mathematical ratios found in nature. After an initial price advance (Wave 1), traders will apply the Fibonacci tool from the start of the move to its peak to project where the Wave 2 trough might form.
It is helpful to think of it this way: Fibonacci levels provide the ‘where’ a trough is likely to form, while the Elliott Wave count provides the ‘when’ by telling you which corrective wave you are in.
Momentum indicators like the Relative Strength Index (RSI) and the MACD (Moving Average Convergence Divergence) help to measure the speed and strength of price movements. As a market approaches a trough, momentum typically wanes. These indicators can signal ‘oversold’ conditions, suggesting that the selling pressure is exhausted.
However, the most powerful signal is bullish divergence. This occurs when the price chart prints a new low, but the momentum indicator fails to make a new low, instead forming a higher low. This divergence shows that even though the price has dipped lower, the selling momentum behind the move is fading fast. It is a classic sign that a trough is forming and a reversal is imminent.
Finally, candlestick patterns can provide the final confirmation. The appearance of a Hammer or a Morning Star pattern right at a key Fibonacci support level, combined with bullish divergence on the RSI, creates a powerful, high-probability setup for a long entry.
The theory behind identifying troughs is powerful, but applying it consistently in live markets requires practice and expertise. This is where Wavetraders simplifies the process for you. Instead of spending hours trying to decipher complex patterns, you can rely on professional analysis that pinpoints significant peaks and troughs across major markets.
Our subscription services—covering FX, Digital Currencies, and Commodities—provide you with daily, actionable wave counts from our expert analysts. We do the heavy lifting of analysing market structure so you can focus on execution. For those who want to build this skill for themselves, the Elliott Wave School offers a structured curriculum with Live Chart examples, helping you transition from learning definitions to executing trades with confidence.
With a Wavetraders membership, you gain access to daily Elliott Wave counts for major FX pairs, indices, and cryptocurrencies. Our analysts are constantly monitoring the markets to identify the next major trough before it fully forms, giving you a strategic edge. By following our professional wave interpretation, you can cut through the daily market ‘noise’ and see the underlying patterns with greater clarity.
If your goal is to achieve true mastery, our Elliott Wave School is the definitive resource. Through step-by-step video lessons, you will learn everything from basic pattern recognition to advanced wave degree analysis. The curriculum is designed to help you build a sustainable trading strategy built around the natural cycles of the market. Stop guessing at market bottoms and start identifying them with precision.
Join the Wavetraders Elliott Wave School to master market cycles
What is a trough in a wave for trading?
In trading, a trough is the lowest point of a price move or wave cycle before the price begins to rise. It represents a point where selling pressure has been exhausted and buyers are beginning to take control, often signalling a potential market bottom and a shift in momentum.
How do you identify a trough on a stock chart?
You can identify a trough by looking for a clear low point in price that is confirmed by other signals. This includes price finding support at a key Fibonacci retracement level, bullish divergence on a momentum indicator like the RSI or MACD, and the formation of bullish candlestick patterns like a Hammer or Morning Star.
What is the difference between a trough and a peak?
A trough is the lowest point of a wave, representing a market bottom. A peak (or crest) is the highest point of a wave, representing a market top. In an uptrend, the market makes a series of higher troughs and higher peaks. In a downtrend, it makes a series of lower troughs and lower peaks.
Can a trough be a buy signal in Elliott Wave theory?
Yes, the trough at the end of a corrective wave is a primary buy signal in Elliott Wave theory. Specifically, the troughs of Wave 2 and Wave 4 are considered high-probability entry points to join the main uptrend just before the next powerful impulse wave (Wave 3 or Wave 5) begins.
How do Fibonacci levels help find a wave trough?
Fibonacci retracement levels act as potential support zones where a corrective wave might end and a trough might form. After an upward move, traders project these levels downwards to anticipate where the price might stop falling. Common levels for troughs are 38.2%, 61.8%, and 78.6%.
What happens to price momentum at a trough?
At a trough, downward price momentum diminishes and begins to shift to upward momentum. This is often visible on indicators like the RSI or MACD, which will show selling pressure fading and may form a ‘bullish divergence’—a powerful signal that a bottom is forming.
Why is identifying Wave 2 troughs so profitable for traders?
Identifying the trough of a Wave 2 is considered highly profitable because it offers an opportunity to enter a trend at an early stage, just before the start of Wave 3. Wave 3 is typically the longest and most powerful wave in the Elliott Wave sequence, offering significant profit potential.
Is every swing low considered a technical wave trough?
No. A ‘swing low’ can be any minor, temporary dip in price. A ‘technical wave trough’, especially in Elliott Wave terms, is a structurally significant low that completes a specific, recognisable corrective pattern. It has a predictable relationship to the surrounding waves, making it a more reliable and meaningful signal for traders.
DISCLAIMER
Any reviews, news, analysis, prices or other information contained on our website is provided as general market commentary and delivered electronically through a distribution channel to larger number of clients, therefore does not constitute investment advice or investment research. We are not trading advisors. Most of our work is for educational purposes only, with information based on Elliott Wave theory in real time. Trading forex, futures, options, stocks, cryptocurrenices or any another trading market carries a high level of risk, and may not be suitable for all investors.
The possibility exists that you could lose some or all of your initial investment; therefore you should not invest money that you cannot afford to lose. Our website and the information that we provide should not be relied upon as a substitute for extensive independent research before making your investment decisions. In no event will we be liable for any loss or damage on your account in connection with, the use of our products. For any real cash investments you have to contact your financial advisor.
Any information or material contained on our website is owned by Val Global d.o.o.. Reproduction is prohibited without Val Global d.o.o. prior license in writing.
By continuing to use the site, you agree to the use of cookies. Learn more.
The cookie settings on this website are set to "allow cookies" to give you the best browsing experience possible. If you continue to use this website without changing your cookie settings or you click "Accept" below then you are consenting to this.