In this educational article, we want to present how the USDCHF pair has been moving nicely according to our expectations over the last couple of weeks. By following the Elliott Wave structure and identifying key corrective patterns, we were able to anticipate the bullish continuation from important support areas.
But it was not only about Elliott waves; we also focused on SNB which was dovish, much more compared to FED where higher inflation is causing some seriosu problems and maybe they will have to rethink their policy actions. US yeilds were on the rise and with SNB being dovish, we saw USDCHF going higher. Plus, SNB even mentioned intervention as a possibility a few times this year. So this makes teh case for Elliott wave bullish pattern even stronger.
The first chart shows how we identified a completed W-X-Y or A-B-C higher-degree correction, from where we expected a continuation of the broader bullish trend. The structure suggested that the downside correction was likely complete and that USDCHF could resume moving higher.
Why? Because when pullbacks lower are overlapping, its normally an indication of a pause rather than continuation south.
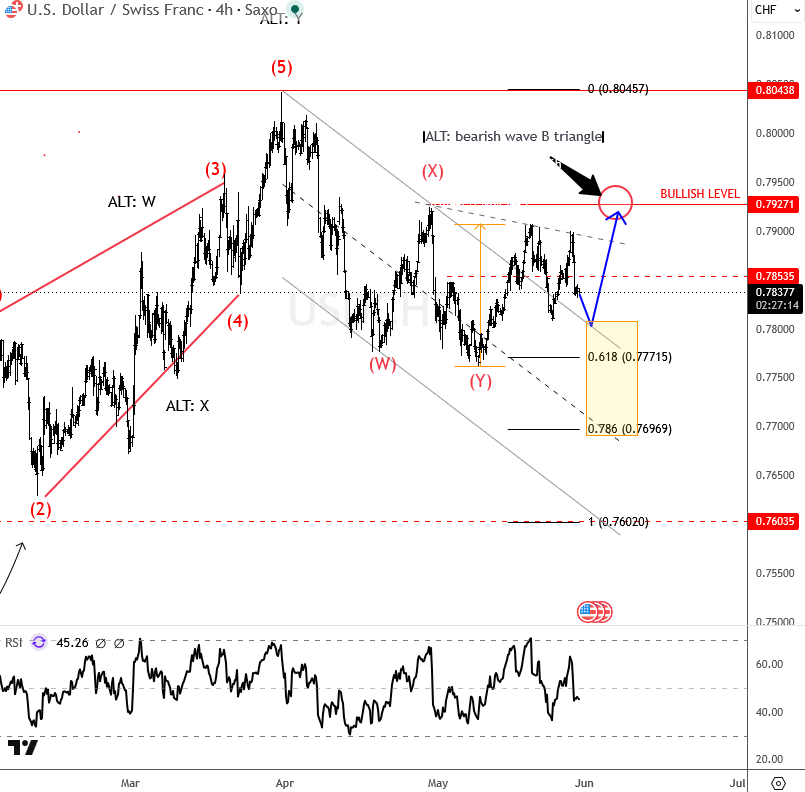
On the chart above you can see important zone for USDCHF bounce highlighted with our yellow box.
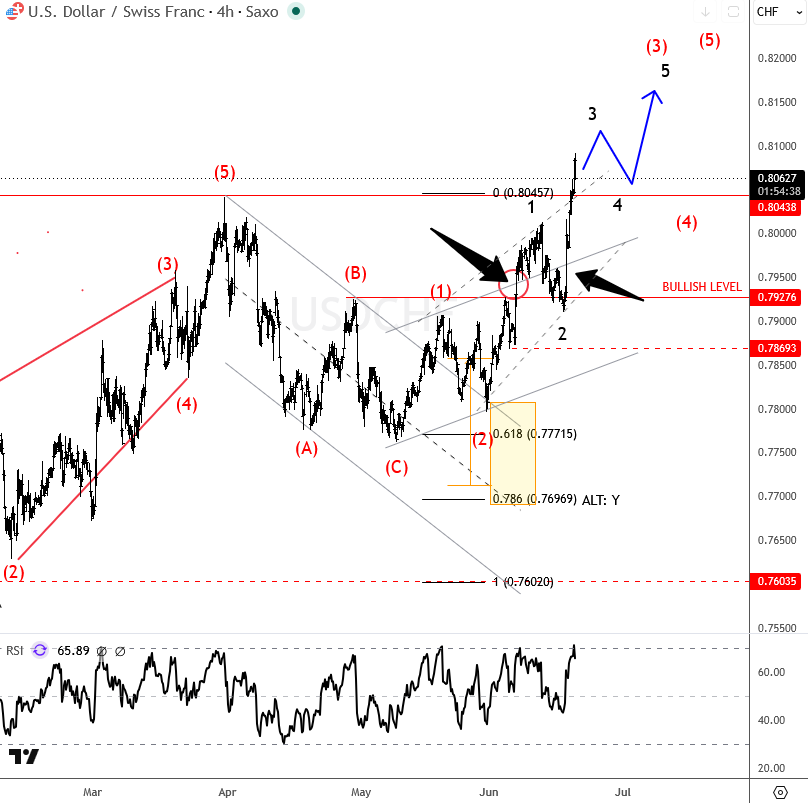
The second chart shows the bullish resumption and breakout back toward the previous highs, where we highlighted the development of wave 3 of (3) within an ongoing five-wave bullish impulse. At that stage, we were expecting further upside, but also warned about the possibility of a corrective wave 4 pullback before the next leg higher.
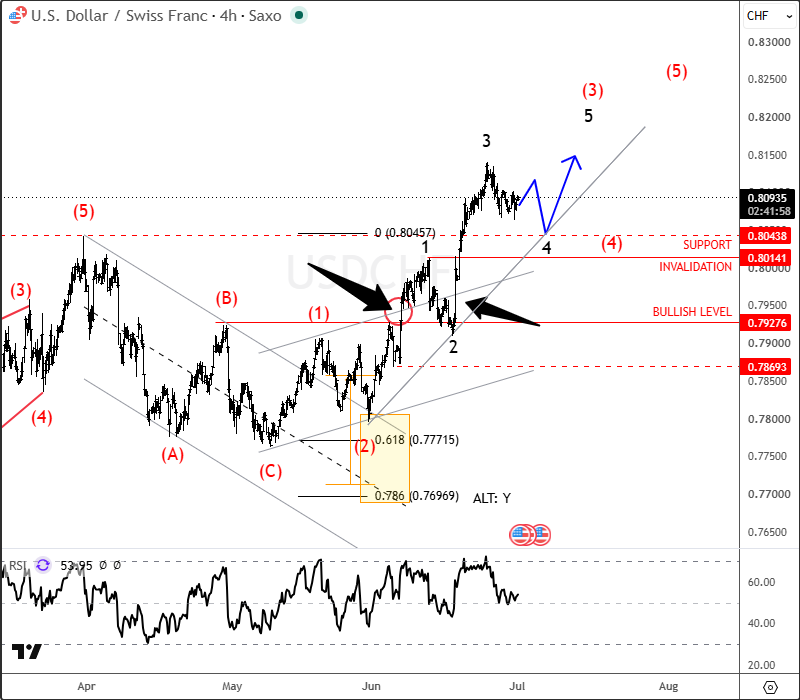
The third chart shows the anticipated corrective slowdown, which we labeled as a projected wave 4 correction. From that area, we were looking for a bullish continuation within the final wave 5 of (3).
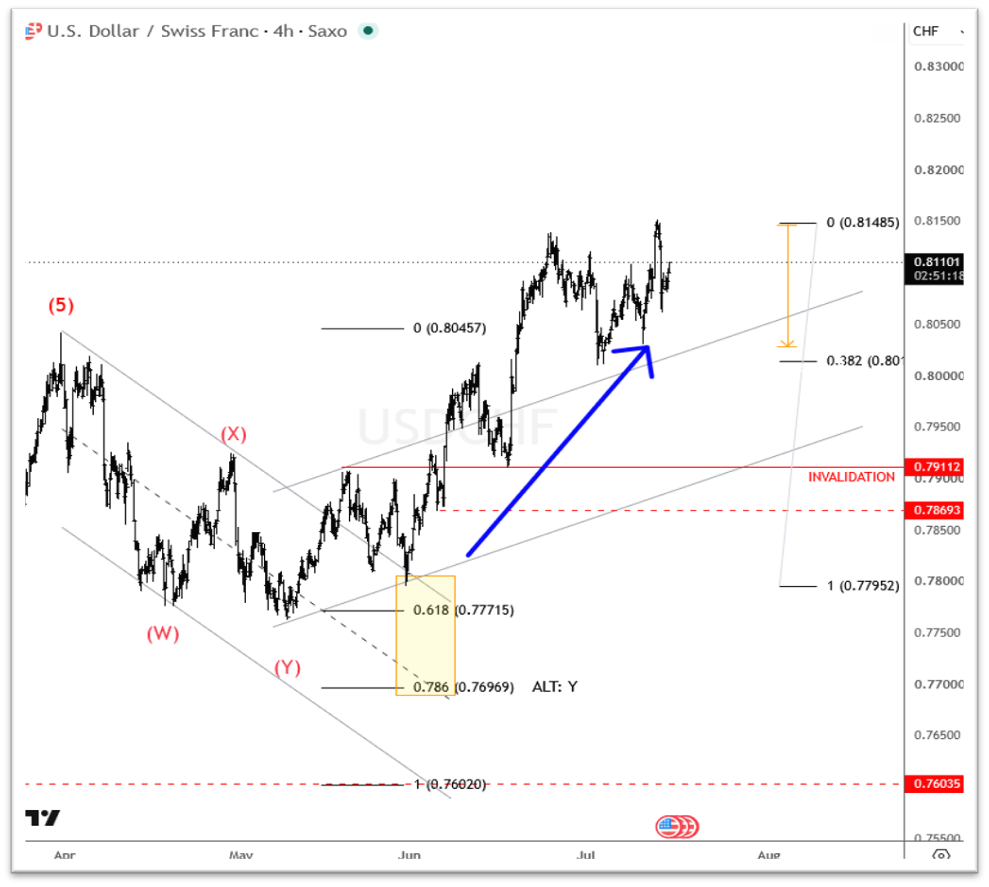
The latest updated chart confirms that scenario, with USDCHF continuing higher within the projected wave 5 of (3). There is still room for further upside toward the 0.82 area, but traders should now start monitoring for signs of a higher-degree wave (4) corrective slowdown once the current impulsive move matures.
If you like this kind of analysis and the reasoning behind each potential wave setup, then we invite you to join our community and get more of our charts with Yellow Boxes, which highlight clear and powerful Elliott Wave patterns, where opportunites can occur.
Trade well
Become a premium member
Get daily Elliott Wave updates for US Single Stocks, SP500,DAX, GOLD, SILVER, CRUDE, FX, CRYPTO, etc. or apply for unlimited access to the Elliot Wave educational videos.