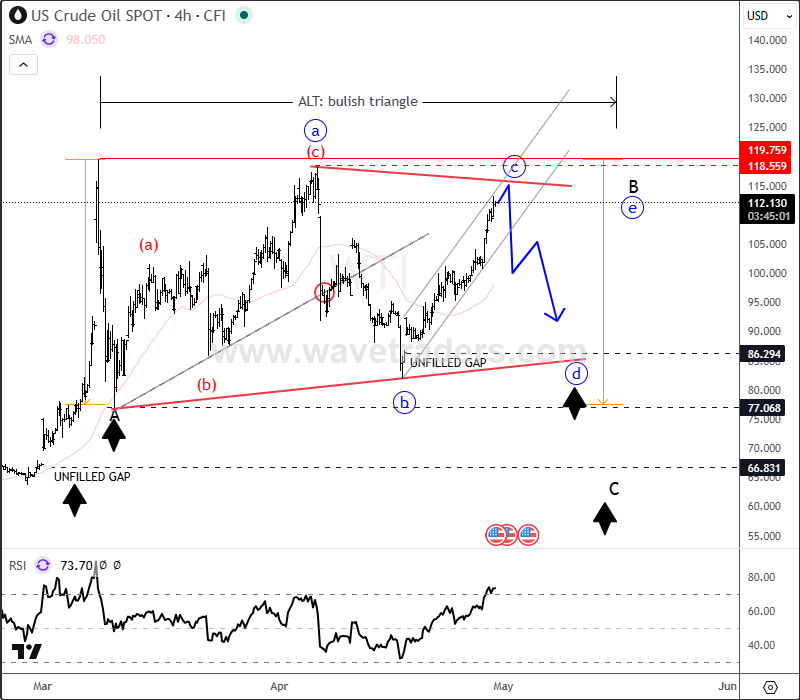
As you know, on crude oil we have been tracking corrective price action since the spike to 119 at the beginning of March. Despite breaking below the trendline support around 95 back on April 8th, the market managed to stabilize around 82, from where we are now seeing a new swing higher.
So rather than a sharp impulsive drop in wave C, it now looks like this could be part of a more complex correction, with a triangle currently the most likely scenario. This is still a bearish pattern, but it allows price to stay trapped in a wider range between roughly 118 and 80 for a bit longer.
Even so, we still think that sooner or later the market will move lower to fill the gaps from April 19th and March 1st, which suggests that this correction from 119 is not finished yet.
In the near term, there is still a chance it’s finishing wave “c” at the upper side of a triangle range, and it may turn lower into wave “d” back to the lower side of a range, possibly from the current key 112-118 resistance area.
Become a premium member
Get daily Elliott Wave updates for US Single Stocks, SP500,DAX, GOLD, SILVER, CRUDE, FX, CRYPTO, etc. or apply for unlimited access to the Elliot Wave educational videos.