Stocks

JPMorgan Flashback Update – From Correction To Bullish ContinuationApr 30, 2026

In our previous analysis published on March 11, we highlighted how JPMorgan Chase & Co. (JPM) was approaching a key support zone between 280 and 290, identifying it as an attractive area for a potential bullish reaction. CHECK IT HERE

JPMorgan Flashback Update – From Correction To Bullish Continuation JPM Daily Chart From March 10
JPM Daily Chart From March 10

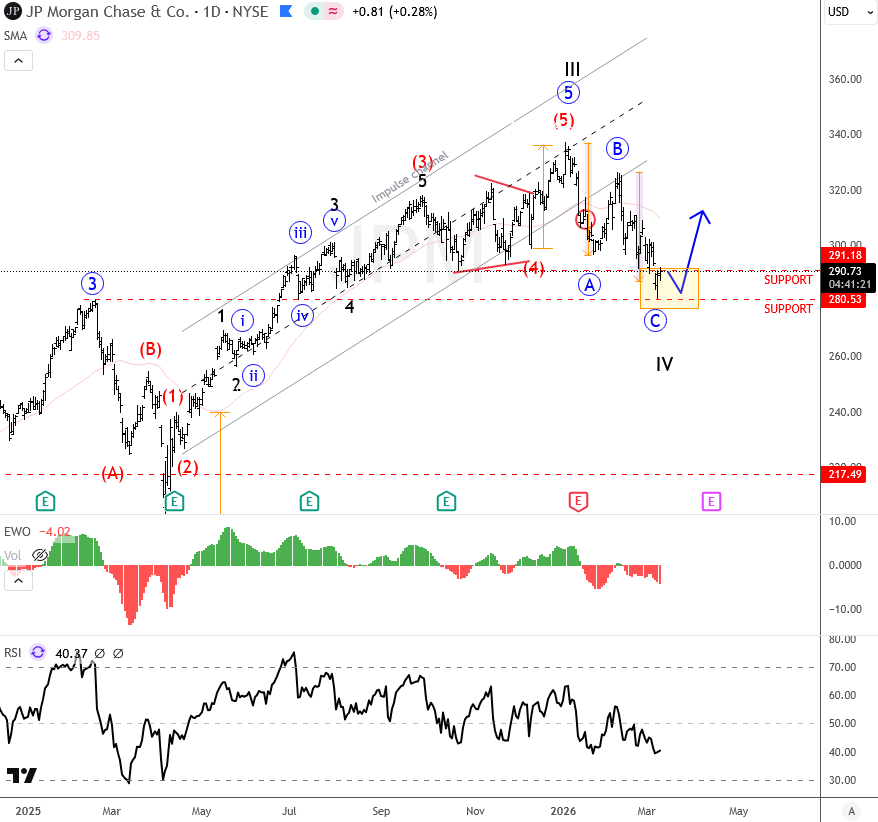
Since then, the market has responded almost exactly as anticipated.

JPMorgan is now seeing a strong recovery after completing only three waves down from the 340 highs, which is a constructive and bullish development. The fact that the decline unfolded in a clear three-wave structure suggests that the move was corrective rather than the start of a larger bearish trend.

Adding to this bullish outlook, price has now broken out of the corrective channel, confirming that the pullback was temporary. The reaction from the February 2025 high—which acted as support—further reinforces the idea that buyers have stepped back in with conviction.

JPMorgan Flashback Update – From Correction To Bullish Continuation JPM Daily Chart From April 30
JPM Daily Chart From April 30

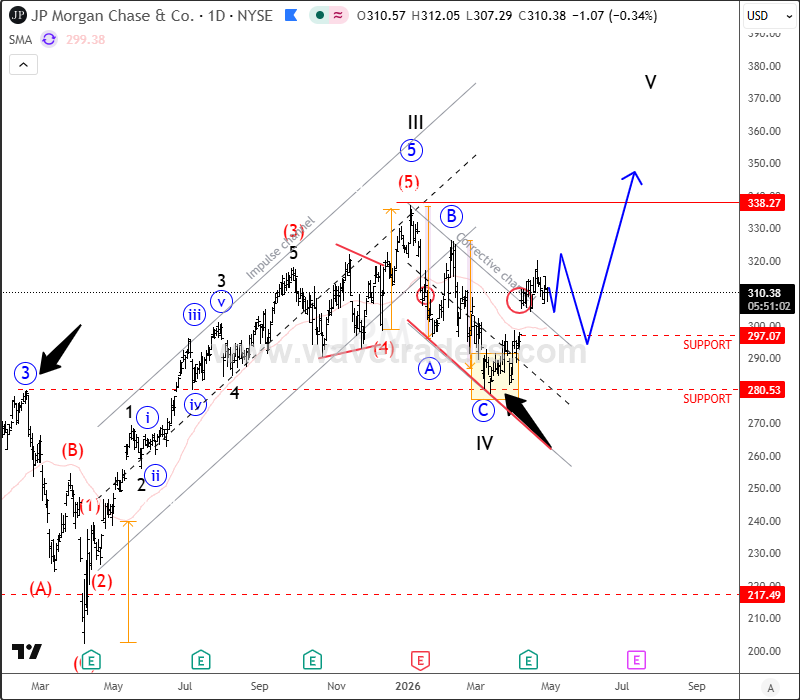
With the correction likely complete, the technical picture now points toward a continuation higher. Under typical wave structure behavior, a completed A-B-C correction within a broader trend is often followed by a push toward previous highs. In this case, that places focus on a retest of the 338 area, with potential for even further upside if a fifth wave extension develops.

The 300 level now stands out as an important support zone, offering a potential area of interest for buyers on dips.


Highlights

  • Three-wave pullback completed, confirming a corrective move
  • Breakout from corrective channel signals a bullish shift
  • Upside continuation expected, with a retest of highs in focus
  • Support on pullbacks around 300
  • Earnings on April 14 acting as a potential catalyst

Become a premium member

Get daily Elliott Wave updates for US Single Stocks, SP500,DAX, GOLD, SILVER, CRUDE, FX, CRYPTO, etc. or apply for unlimited access to the Elliot Wave educational videos.

Funded Trader Program

“Trade our money and collect the profits.”

Learn Elliott Waves

Access to more than 7 hours of educational material

DISCLAIMER

Any reviews, news, analysis, prices or other information contained on our website is provided as general market commentary and delivered electronically through a distribution channel to larger number of clients, therefore does not constitute investment advice or investment research. We are not trading advisors. Most of our work is for educational purposes only, with information based on Elliott Wave theory in real time. Trading forex, futures, options, stocks, cryptocurrenices or any another trading market carries a high level of risk, and may not be suitable for all investors.

The possibility exists that you could lose some or all of your initial investment; therefore you should not invest money that you cannot afford to lose. Our website and the information that we provide should not be relied upon as a substitute for extensive independent research before making your investment decisions. In no event will we be liable for any loss or damage on your account in connection with, the use of our products. For any real cash investments you have to contact your financial advisor.

Any information or material contained on our website is owned by Val Global d.o.o.. Reproduction is prohibited without Val Global d.o.o. prior license in writing.

By continuing to use the site, you agree to the use of cookies. Learn more.

The cookie settings on this website are set to "allow cookies" to give you the best browsing experience possible. If you continue to use this website without changing your cookie settings or you click "Accept" below then you are consenting to this.

Close