We talked about Kaspa back on October 29 2025, where we mentioned and highlighted a completed weekly higher degree ABC correction due to a huge spike and market manipulation. CLICK HERE
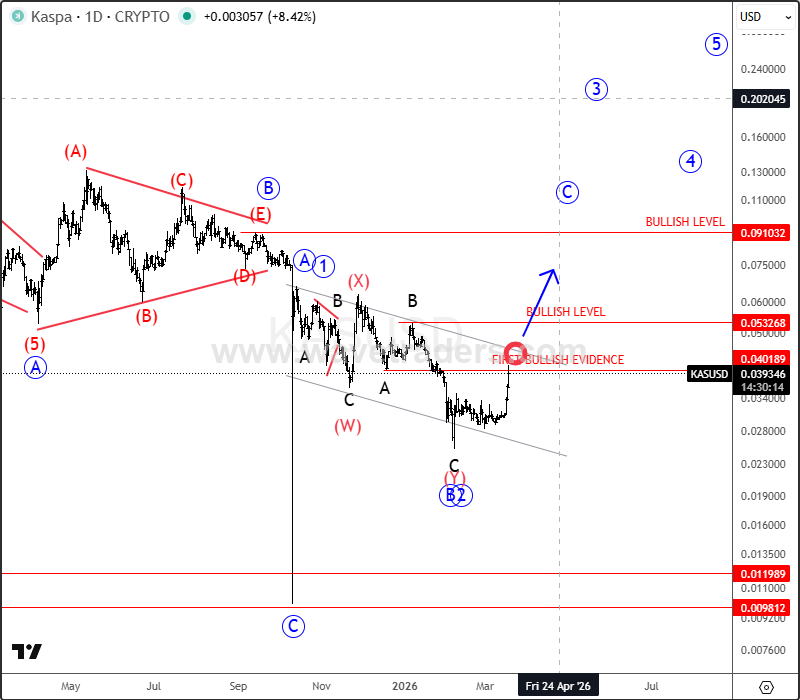
Kaspa (KASUSD) is showing a constructive rebound on the daily chart following a completed complex WXY correction within wave B/2. After revisiting the key support zone around 0.04, price action suggests that a new impulsive phase—either wave C or wave 3—is now underway.A sustained move above the 0.05 bullish confirmation level, combined with a breakout from the descending channel resistance, would further validate this outlook. In such a scenario, the next upside targets are projected in the 0.09–0.10 region, aligning with typical wave C or extended wave 3 projections.
Become a premium member
Get daily Elliott Wave updates for US Single Stocks, SP500,DAX, GOLD, SILVER, CRUDE, FX, CRYPTO, etc. or apply for unlimited access to the Elliot Wave educational videos.