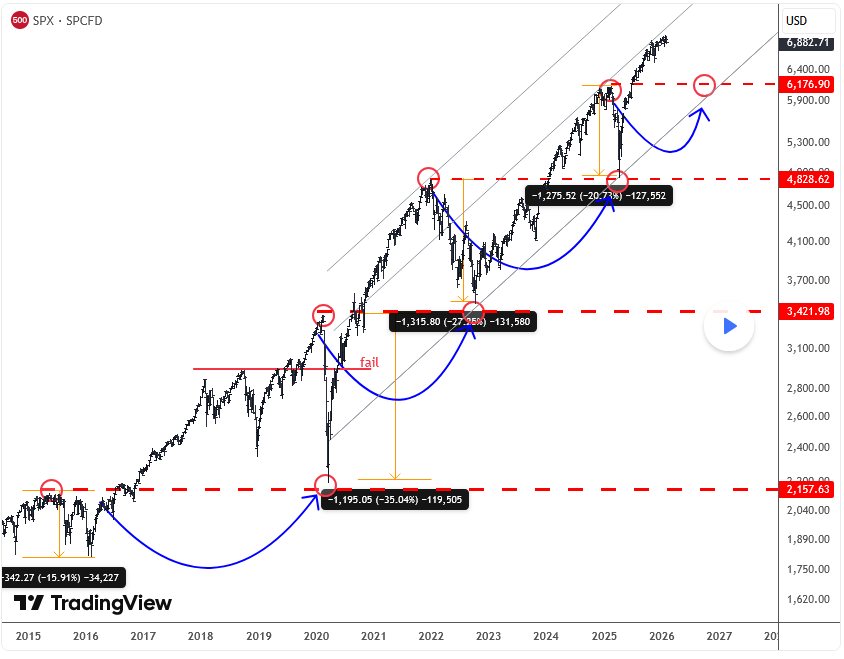
Whenever stocks pull back, the key thing I would watch is whether the old high can hold as new support. This is one of the most consistent features of a healthy bull market, and the SPX chart illustrates this perfectly over multiple cycles. Each major advance eventually runs into a correction, often sharp and emotional, but as long as the prior breakout level holds, the broader trend remains intact.
Looking back, we can see several deep pullbacks that initially looked like trend reversals. In reality, they were corrective phases within a rising channel. Once price retested former resistance and buyers stepped back in, the market resumed higher, often with strong impulsive follow-through.
You can enjoy analysis like this on daily basis for Forex, Stocks, Commodities and Crypto right here – https://wavetraders.com/elliott-wave-plans/
Well, the reason why I bring this chart on is because I see Dollar making some important recovery and if this strength will resume, stocks can see a pullback, as more investors seems to be selling more and more assets and moving into cash. First was cryptos, then metals, and now just wondering if stocks are next. But 10-12% can be enough; we may not see 20% drop like before. Because always when market goes higher and higher, pullbacks in % are smaller. And one more thing, Trump will 100% try to defend any kind of a strong sell-off…
Be careful, wait on better levels, then chasing new entries here.
GH
Become a premium member
Get daily Elliott Wave updates for US Single Stocks, SP500,DAX, GOLD, SILVER, CRUDE, FX, CRYPTO, etc. or apply for unlimited access to the Elliot Wave educational videos.