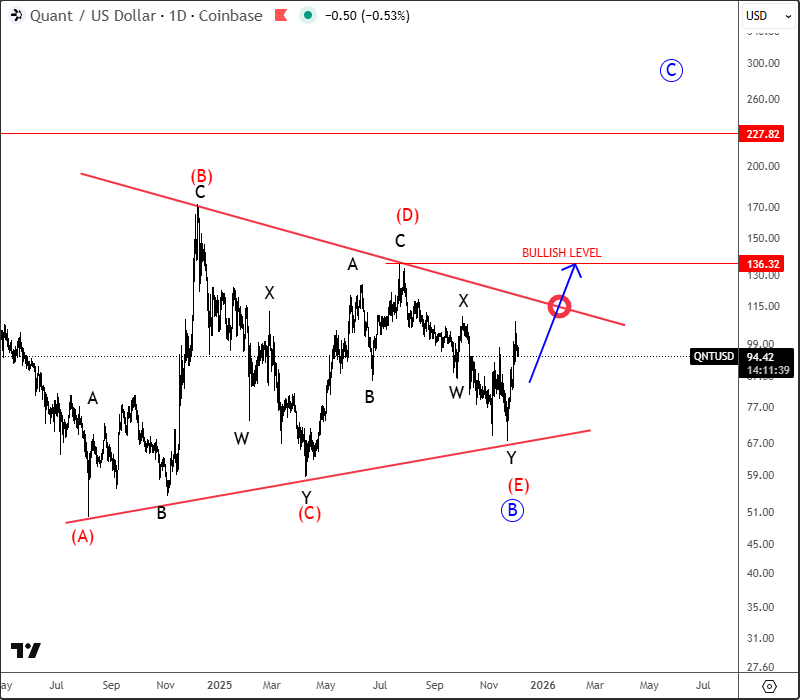
Quant with ticker QNTUSD is still holding up well above the lower triangle line, so bulls are still here. We can now see it finishing a bullish triangle pattern in wave B before we may see another rally for wave C. On a daily chart, it may actually have a completed complex W-X-Y decline within final wave (E) of B, but bullish confirmation for wave C is only above upper triangle line and 136 level.
Become a premium member
Get daily Elliott Wave updates for US Single Stocks, SP500,DAX, GOLD, SILVER, CRUDE, FX, CRYPTO, etc. or apply for unlimited access to the Elliot Wave educational videos.