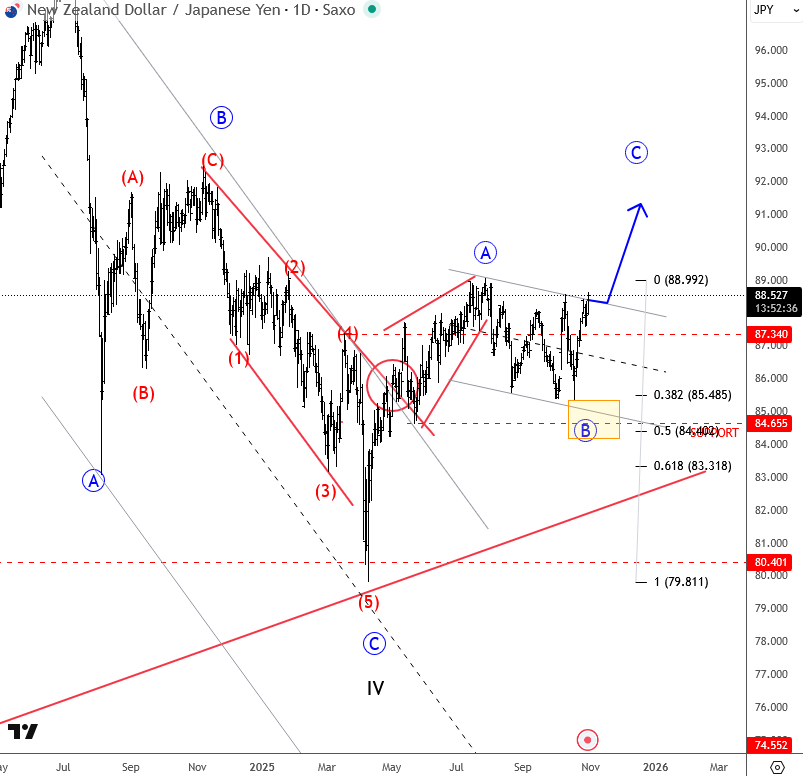
We talked about NZDJPY already back on July 29, where we mentioned and highlighted a bullish turn with a leading diagonal formation into wave A, suggesting more upside after a pullback in wave B. CLICK HERE
Later on September 30, we updated the chart, when we spotted a corrective pullback in wave B, indicating it was forming a bullish setup formation with waves A and B that can send the price higher for wave C. CLICK HERE
As you can see today on October 30, NZDJPY can be on the way higher within a projected wave C and there’s plenty of room for further recovery, just watch out on short-term pullbacks.
Become a premium member
Get daily Elliott Wave updates for US Single Stocks, SP500,DAX, GOLD, SILVER, CRUDE, FX, CRYPTO, etc. or apply for unlimited access to the Elliot Wave educational videos.