Gold has seen a nice recovery recently, and we tracked it very closely with our members on a daily basis. If you will find analysis usefull check our premium services
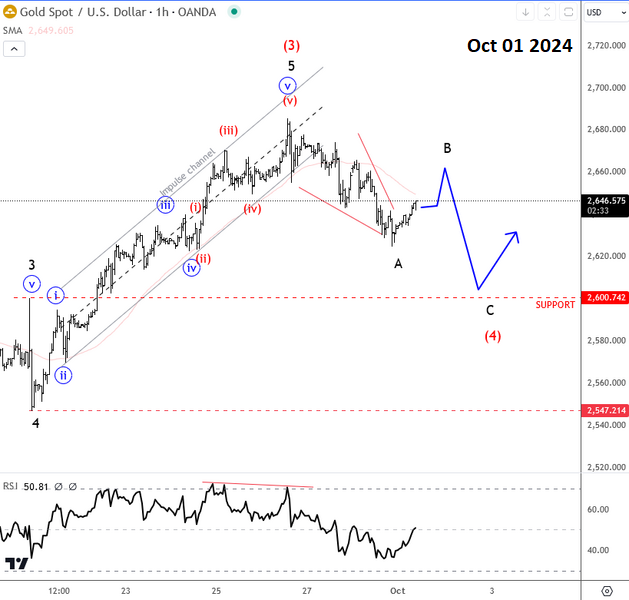
On October 1st we noticed a completed impulse within wave (3) due to big intraday drop as part of a leading diagonal formation, so we mentioned and highlighted a that higher degree A-B-C correction in wave (4) that can retrace the price back to 2600 support area as indicated by the blue arrow.

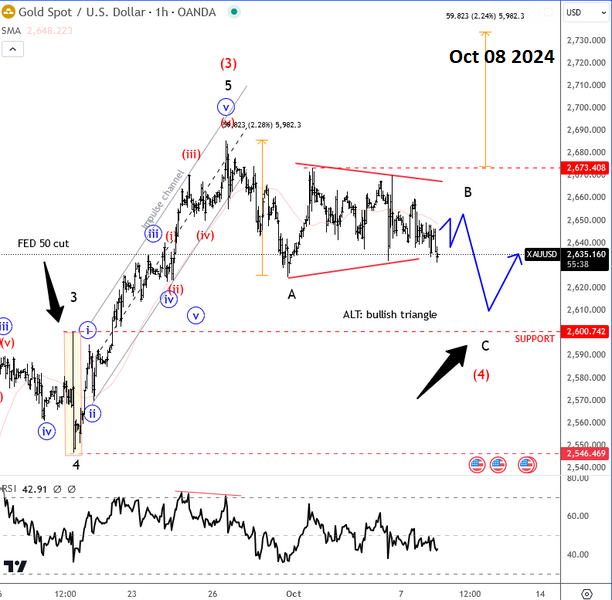
A week later on October 08, the price was slow and sideways which we saw it as a wave B bearish triangle pattern that can push the price lower for wave C into strong 2600 support area.
We even shared Trading Note Idea at the time.


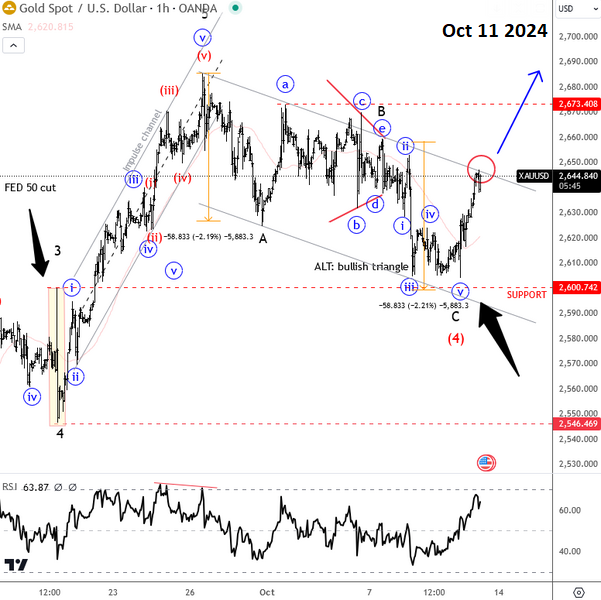
As you can see on October 11, gold came nicely lower for wave C into projected 2600 support area, from where we have seen sharp rebound. It was a signal for a completed A-B-C correction in wave (4) and that wave (5) is underway.

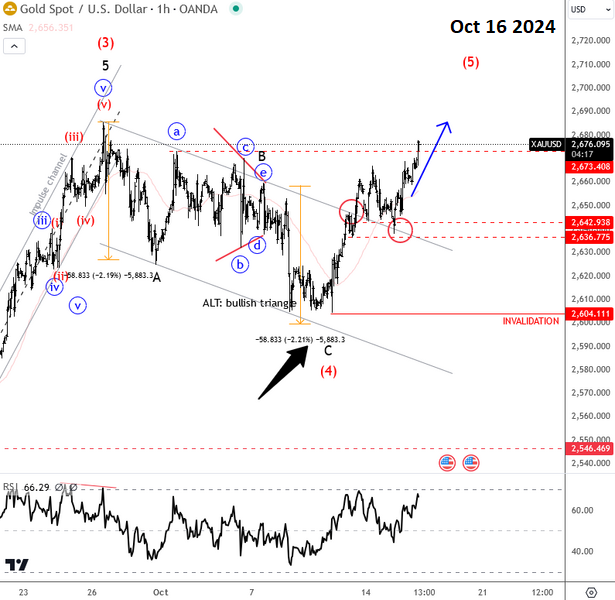
No, a few days later, on October 16, gold remains nicely bullish for wave (5) and there can be room even up to 2700 area before market finds the resistance.

Become a premium member
Get daily Elliott Wave updates for US Single Stocks, SP500,DAX, GOLD, SILVER, CRUDE, FX, CRYPTO, etc. or apply for unlimited access to the Elliot Wave educational videos.