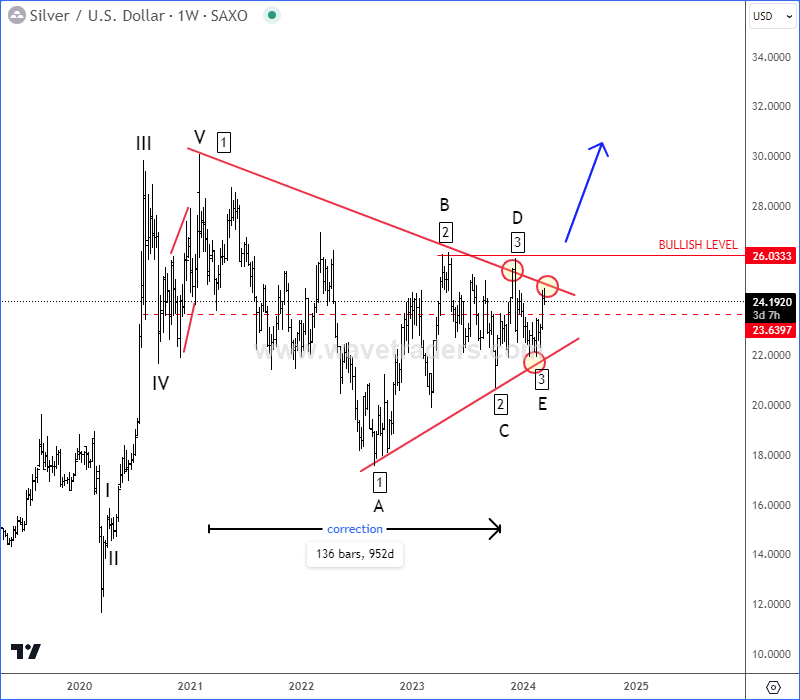
Silver Is Bouncing From The Support, as we see it finishing a bullish triangle pattern that can cause a bullish breakout by Elliott wave theory.
We talked about silver (XAGUSD) in January, where we mentioned and highlighted strong support at the lower side of a triangle range. On January 23rd we shared a free weekly chart of silver, where we warned about limited weakness and sideways contracting triangle range. CLICK HERE
As you can see today, silver bounced from the lower triangle line and it’s back to the upper side of a triangle range, which can be signal for a completed A-B-C-D-E bullish triangle pattern, but bullish confirmation and real bullish breakout is only above 26 region.

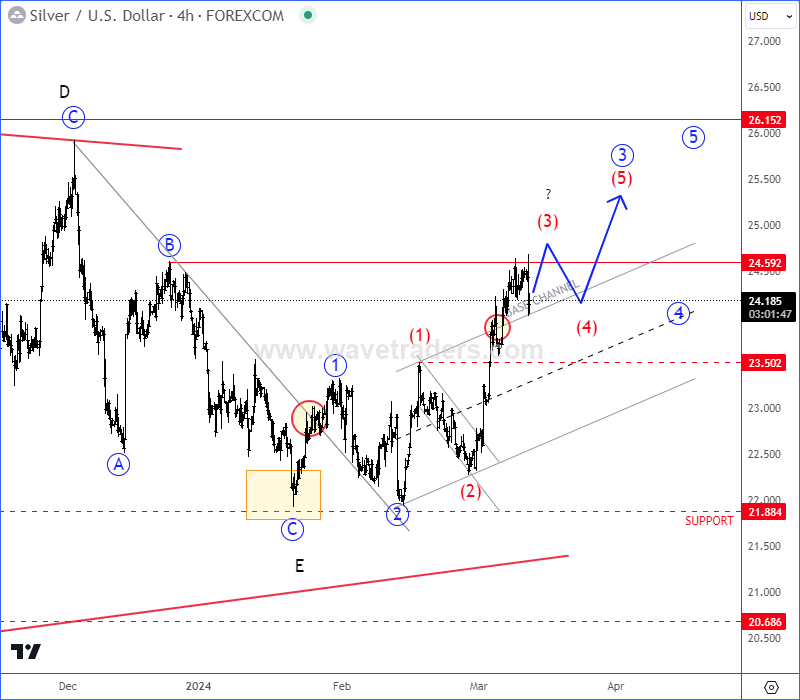
Not only this, On January 25th we also shared 4-hour chart of silver, where we spotted the support for the final wave E of a bullish triangle pattern. CLICK HERE
As you can see today, silver is nicely recovering away from that support and looks like an impulse. It’s probably unfolding a new five-wave bullish cycle of different degrees, which will most likely send the price above 26 region, just be aware of short-term 4th wave pullbacks.

Become a premium member
Get daily Elliott Wave updates for US Single Stocks, SP500,DAX, GOLD, SILVER, CRUDE, FX, CRYPTO, etc. or apply for unlimited access to the Elliot Wave educational videos.
Bitcoin Dominance Is Still Here. Check our free chart HERE.